Download
1 / 47
500 likes | 867 Views
Chapter 3 National Income Determination. I- Introduction CMBUkenHBicarNaelIcMnayb:gR)afña b¤cMnayEdleKeRKagTuk karBitcMnayb:gR)afña KWBuMEmnCakarcaytamkarRsemIRsémeT KWkarcayedayEp¥kelIFnFanrbs;eK .

E N D
Chapter 3National Income Determination I- Introduction • CMBUkenHBicarNaelIcMnayb:gR)afña b¤cMnayEdleKeRKagTuk karBitcMnayb:gR)afña KWBuMEmnCakarcaytamkarRsemIRsémeT KWkarcayedayEp¥kelIFnFanrbs;eK . • cMNayb:gR)afñabegáIteLIgnUv³kareRbIR)as;> karvinieyaK> karTijrbs;rdæaPi)al> nigkarnaMecjedayb:gR)afña ykmkKit sMrab;cMnay edayb:gR)afñasrub . • cMnayb:gR)afñaelI TMnij nig esvakmµEdl)anplitkñúgRsukehAfa cMnay dul • (Desire Aggregate Expenditure) or(Aggregate Expenditure=AE) AE = C + I + G + (X-M)
5- Part B Measuring a Nation’s Income You need to bring a calculator to this class!
In this chapter, look for the answers to these questions: • What is Gross Domestic Product (GDP)? • How is GDP related to a nation’s total income and spending? • What are the components of GDP? • How is GDP corrected for inflation? • Does GDP measure society’s well-being? CHAPTER 5 PART B MEASURING A NATION’S INCOME
Microeconomics vs. Macroeconomics • Microeconomics: Is the study of how individual households and firms make decisions, interact with one another in markets. • Macroeconomics: Is the study of the economy as a whole. • We begin our study of macroeconomics with the country’s total income and expenditure. CHAPTER 5 PART B MEASURING A NATION’S INCOME
Income and Expenditure • Gross Domestic Product (GDP): It measures total income of everyone in the economy. • GDP also measures total expenditure on the economy’s output of goods and services. For the economy as a whole, income equals expenditure, because every dollar of expenditure by a buyer is a dollar of income for the seller.
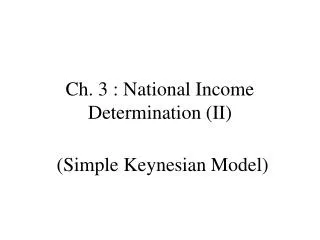
The Circular-Flow Diagram • It is a simple depiction of the macroeconomy. • It illustrates GDP as spending, revenue, factor payments, and income. • First, recall that: • Factors of productionare inputs like labor, land, capital, and entrepreneur. • Factor paymentsare payments to the factors of production (e.g., wages, rent). CHAPTER 5 PART B MEASURING A NATION’S INCOME
Firms Households FIGURE 1: The Circular-Flow Diagram Households: • own the factors of production, sell/rent them to firms for income • buy and consume g&s
Firms FIGURE 1: The Circular-Flow Diagram Households Firms: • buy/hire factors of production, use them to produce g&s • sell g&s
Revenue (=GDP) Spending (=GDP) Markets for Goods & Services G & S sold G & S bought Firms Households Factors of production Labor, land, capital Markets for Factors of Production Income (=GDP) Wages, rent, profit (=GDP) FIGURE 1: The Circular-Flow Diagram
What This Diagram Omits • The government • collects taxes • purchases goods and services (g&s) • The financial system • matches savers’ supply of funds with borrowers’ demand for loans • The foreign sector • trades g&s, financial assets, and currencies with the country’s residents
Gross Domestic Product (GDP) Is… …the market value of all final goods & services produced within a country in a given period of time. Goods are valued at their market prices, so: • GDP measures all goods using the same units (e.g., dollars in the U.S.), rather than “adding apples to oranges.” • Things that don’t have a market value are excluded, e.g., housework you do for yourself.
Gross Domestic Product (GDP) Is… …the market value of all final goods & services produced within a country in a given period of time. Final goodsare intended for the end user. Intermediate goods are used as components or ingredients in the production of other goods. GDP only includes final goods, as they already embody the value of the intermediate goods used in their production.
Gross Domestic Product (GDP) Is… …the market value of all final goods & services produced within a country in a given period of time. GDP includes tangible goods (like DVDs, mountain bikes, beer) and intangible services (dry cleaning, concerts, cell phone service).
Gross Domestic Product (GDP) Is… …the market value of all final goods & services produced within a country in a given period of time. GDP includes currently produced goods, not goods produced in the past.
Gross Domestic Product (GDP) Is… …the market value of all final goods & services produced within a country in a given period of time. GDP measures the value of production that occurs within a country’s borders, whether done by its own citizens or by foreigners located there.
Gross Domestic Product (GDP) Is… …the market value of all final goods & services produced within a country in a given period of time. usually a year or a quarter (3 months).
The Components of GDP • Recall: GDP is total spending. • GDP has four components: • Consumption (C) • Investment (I) • Government Purchases (G) • Net Exports (NX) • These components add up to GDP (denoted Y): Y = C + I + G + NX
Consumption (C) • is total spending by households on g&s. • Note on housing costs: • For renters, consumption includes rent payments. • For homeowners, consumption includes the imputed rental value of the house, but not the purchase price or mortgage payments. See the footnotes on the next slide for more details.
Investment (I) • is total spending on goods that will be used in the future to produce more goods. • includes spending on: • capital equipment (e.g., machines, tools) • structures (factories, office buildings, houses) • inventories (goods produced but not yet sold) Note: “Investment” does not mean the purchase of financial assets like stocks and bonds.
Government Purchases (G) • is all spending on the g&s purchased by govt at the federal, state, and local levels. • G excludes transfer payments, such as Social Security or unemployment insurance benefits. These payments represent transfers of income, not purchases of goods & service. CHAPTER 5 PART B MEASURING A NATION’S INCOME
Net Exports (NX) • NX = exports – imports • Exports represent foreign spending on the economy’s g&s. • Imports are the portions of C, I, and Gthat are spent on g&s produced abroad. • Adding up all the components of GDP gives: Y = C + I + G + NX
billions % of GDP per capita Y $12,480 100.0 $42,035 C 8,746 70.1 29,460 I 2,100 16.8 7,072 G 2,360 18.9 7,950 NX –726 –5.8 –2,444 U.S. GDP and Its Components, 2005 Source for data on GDP & components: http://www.bea.doc.gov Students go to the same source for up to date data.
ACTIVE LEARNING 1: GDP and its components In each of the following cases, determine how much GDP and each of its components is affected (if at all). A.Debbie spends $200 to buy her husband dinner at the finest restaurant in Boston. B.Sarah spends $1800 on a new laptop to use in her publishing business. The laptop was built in China. C.Jane spends $1200 on a computer to use in her editing business. She got last year’s model on sale for a great price from a local manufacturer. D.General Motors builds $500 million worth of cars, but consumers only buy $470 million worth of them. 23
ACTIVE LEARNING 1: Answers A.Debbie spends $200 to buy her husband dinner at the finest restaurant in Boston. Consumption and GDP rise by $200. B.Sarah spends $1800 on a new laptop to use in her publishing business. The laptop was built in China. Investment rises by $1800, net exports fall by $1800, GDP is unchanged. 24
ACTIVE LEARNING 1: Answers C.Jane spends $1200 on a computer to use in her editing business. She got last year’s model on sale for a great price from a local manufacturer. Current GDP and investment do not change, because the computer was built last year. D.General Motors builds $500 million worth of cars, but consumers only buy $470 million of them. Consumption rises by $470 million, inventory investment rises by $30 million, and GDP rises by $500 million. 25
Real versus Nominal GDP • Inflation can distort economic variables like GDP, so we have two versions of GDP: One is corrected for inflation, the other is not. • Nominal GDPvalues output using current prices. Nominal GDP is not corrected for inflation. • Real GDPvalues output using the prices of a base year. Real GDP is corrected for inflation.
37.5% 30.9% EXAMPLE: (Assume we are producing only two goods) Compute nominal GDP in each year: 2002: $10 x 400 + $2 x 1000 = $6,000 2003: $11 x 500 + $2.50 x 1100 = $8,250 2004: $12 x 600 + $3 x 1200 = $10,800 % Change: Note: 30.9% = (10,800 / 8,250) – 1 * 100
Example (Continued) • In pervious example, nominal GDP grows for two reasons: prices are rising, and the economy is producing a larger quantity of goods. • Thinking of nominal GDP as total income, the increases in income will overstate the increases in society’s well-being, because part of these increases are due to inflation. • We need a way to take out the effects of inflation, to see how much people’s incomes are growing in purchasing power terms. That is the job of real GDP. For this, see next slide.
$10 $2.00 20.0% 16.7% EXAMPLE (Continued): Compute real GDP in each year, using 2002 as the base year: % Change: 2002: $10 x 400 + $2 x 1000 = $6,000 2003: $10 x 500 + $2 x 1100 = $7,200 2004: $10 x 600 + $2 x 1200 = $8,400
Example (Continued) • Previous example shows that real GDP in every year is constructed using the prices of the base year, and that the base year doesn’t change. • The growth rate of real GDP from one year to the next is the answer to the following question: • “How much would GDP (and hence everyone’s income) have grown if there had been zero inflation?” • Thus, real GDP is corrected for inflation.
EXAMPLE (Continued): Summary of Previous Two Slides In each year, • Nominal GDP is measured using the current prices. • Real GDP is measured using constant prices from the base year (2002 in this example).
Example (Continued) • Question: • “How much would GDP (and hence everyone’s income) have grown if there had been zero inflation?” • Again, the growth rate of real GDP from one year to the next is the answer to this question, and this is why real GDP is corrected for inflation. See next slide.
37.5% 20.0% 30.9% 16.7% Note: 16.7% = (8,400/7,200) -1 * 100 EXAMPLE (Continued): • The change in nominal GDP reflects both prices and quantities. • The change in real GDPis the amount that GDP would change if prices were constant (i.e., if there had been zero inflation). Hence, real GDP is corrected for inflation.
Nominal and Real GDP in the U.S., 1965-2005 Real GDP (base year 2000) Nominal GDP See notes to this slide
GDP deflator = 100 x nominal GDP real GDP The GDP Deflator • The GDP deflator is a measure of the overall level of prices. • Definition: • One way to measure the economy’sinflation rateis to compute the percentage increase in the GDP deflator from one year to the next.
100.0 14.6% 114.6 12.2% 128.6 2002: 100 x (6000/6000) = 100.0 2003: 100 x (8250/7200) = 114.6 2004: 100 x (10,800/8400) = 128.6 EXAMPLE (Continued): Compute the GDP deflator in each year: (128.6/114.6) -1 * 100 = 12.2%
ACTIVE LEARNING 2: Computing GDP Use the above data to solve these problems: A. Compute nominal GDP in 2004. B. Compute real GDP in 2005. C. Compute the GDP deflator in 2006. 37
ACTIVE LEARNING 2: Answers A. Compute nominal GDP in 2004. $30 x 900 + $100 x 192 = $46,200 B. Compute real GDP in 2005. $30 x 1000 + $100 x 200 = $50,000 38
ACTIVE LEARNING 2: Answers C. Compute the GDP deflator in 2006. Nom GDP = $36 x 1050 + $100 x 205 = $58,300 Real GDP = $30 x 1050 + $100 x 205 = $52,000 GDP deflator = 100 x (Nom GDP)/(Real GDP) = 100 x ($58,300)/($52,000) = 112.1 39
GDP and Economic Well-Being • Real GDP per capita is the main indicator of the average person’s standard of living. • Most economists, policymakers, social scientists, and businesspersons use a country’s real GDP per capita as the main indicator of the average person’s standard of living in that country. • But GDP is not a perfect measure of well-being. • Robert Kennedy issued a very eloquent yet harsh criticism of GDP:
Gross Domestic Product… It does not include the beauty of our poetry or the strength of our marriages, the intelligence of our public debate or the integrity of our public officials. “… does not allow for the health of our children, the quality of their education, or the joy of their play. It measures neither our courage, nor our wisdom, nor our devotion to our country. It measures everything, in short, except that which makes life worthwhile, and it can tell us everything about America except why we are proud that we are Americans.” - Senator Robert Kennedy, 1968
GDP is not a perfect measure of well-being • Much of what Robert Kennedy said about GDP is correct. • GDP does not value the quality of the environment. • GDP does not value leisure time. • GDP does not value non-market activity, such as the child care a parent provides his/her child at home. • GDP does not value an equitable distribution of income.
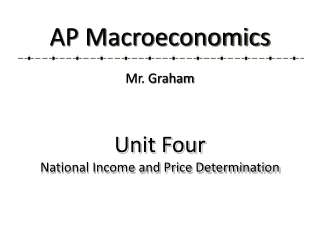
Then Why Do We Care About GDP? • Having a large GDP enables a country to afford better schools, a cleaner environment, health care, etc. • In short, GDP does not directly measure those things that make life worthwhile, but it does measure our ability to obtain the inputs into a worthwhile life. • Many indicators of the quality of life are positively correlated with GDP. For example…
GDP and Life Expectancy in 12 Countries Life expectancy (in years) Japan U.S. Germany Mexico China Brazil Indonesia Russia India Pakistan Bangladesh Nigeria Real GDP per capita, 2002
GDP and Adult Literacy in 12 Countries Adult Literacy (% of population) Russia U.S. China Japan Mexico Germany Brazil Indonesia Nigeria India Pakistan Bangladesh Real GDP per capita, 2002
GDP and Internet Usage in 12 Countries Internet Usage (% of population) U.S. Japan Germany The lowest-income countries are all clustered near the origin, so their names don’t all fit on the graph. Mexico China Brazil Russia Real GDP per capita, 2002
CHAPTER SUMMARY • Gross Domestic Product (GDP) measures a country’s total income and expenditure. • The four spending components of GDP include: Consumption, Investment, Government Purchases, and Net Exports. • Nominal GDP is measured using current prices. Real GDP is measured using the prices of a constant base year, and is corrected for inflation. • GDP is the main indicator of a country’s economic well-being, even though it is not perfect. CHAPTER 5 PART B MEASURING A NATION’S INCOME