
Uploaded by
savea
8 SLIDES
263 VIEWS
80LIKES
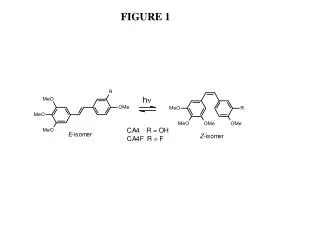
FIGURE 1
DESCRIPTION
FIGURE 1. FIGURE 2. 540 580 620 660 700. Absorption Fluorescence. 2-Photon cross section ( s 2 ) GM units. Normalised Absorbance. Wavelength (nm). FIGURE 3. . t , ns. f. t, E -CA4 t, E -CA4F f , E -CA4. Log(viscosity) mPa.s. FIGURE 4. C. FIGURE 5A. a. b.
Download
1 / 8
Download Presentation 
FIGURE 1
An Image/Link below is provided (as is) to download presentation
Download Policy: Content on the Website is provided to you AS IS for your information and personal use and may not be sold / licensed / shared on other websites without getting consent from its author.
Content is provided to you AS IS for your information and personal use only.
Download presentation by click this link.
While downloading, if for some reason you are not able to download a presentation, the publisher may have deleted the file from their server.
During download, if you can't get a presentation, the file might be deleted by the publisher.
E N D
Presentation Transcript
FIGURE 2 540 580 620 660 700 Absorption Fluorescence 2-Photon cross section (s2) GM units Normalised Absorbance Wavelength (nm)
FIGURE 3 . t, ns f t, E-CA4 t, E-CA4F f, E-CA4 Log(viscosity) mPa.s
FIGURE 4 C
FIGURE 5A a b c e d Fluorescence lifetime (ps)
FIGURE 5B a c b e d Fluorescence lifetime (ps)
FIGURE 5C a b c d e Fluorescence lifetime (ps)
A B … . … . … . … . C FIGURE 6 …… ……


More Related
Audio
Live Player