Data Warehousing and Decision Support
530 likes | 756 Views
Data Warehousing and Decision Support. Data Warehousing and OLAP Technology. What is a data warehouse? A multi-dimensional data model Data warehouse architecture Data warehouse implementation Further development of data cube technology From data warehousing to data mining.

Data Warehousing and Decision Support
E N D
Presentation Transcript
Data Warehousing and OLAP Technology • What is a data warehouse? • A multi-dimensional data model • Data warehouse architecture • Data warehouse implementation • Further development of data cube technology • From data warehousing to data mining
What is Data Warehouse? • Defined in many different ways, but not rigorously. • A decision support database that is maintained separately from the organization’s operational database • Supports information processing by providing a solid platform of consolidated, historical data for analysis. • “A data warehouse is asubject-oriented, integrated, time-variant, and nonvolatilecollection of data in support of management’s decision-making process.”—W. H. Inmon • Data warehousing: • The process of constructing and using data warehouses
Data Warehouse—Subject-Oriented • Organized around major subjects, such as customer, product, sales. • Focusing on the modeling and analysis of data for decision makers, not on daily operations or transaction processing. • Provide a simple and concise view around particular subject issues by excluding data that are not useful in the decision support process.
Data Warehouse—Integrated • Constructed by integrating multiple, heterogeneous data sources • relational databases, flat files, on-line transaction records • Data cleaning and data integration techniques are applied. • Ensure consistency in naming conventions, encoding structures, attribute measures, etc. among different data sources • E.g., Hotel price: currency, tax, breakfast covered, etc. • When data is moved to the warehouse, it is converted.
Data Warehouse—Time Variant • The time horizon for the data warehouse is significantly longer than that of operational systems. • Operational database: current value data. • Data warehouse data: provide information from a historical perspective (e.g., past 5-10 years) • Every key structure in the data warehouse • Contains an element of time, explicitly or implicitly • But the key of operational data may or may not contain “time element”.
Data Warehouse—Non-Volatile • A physically separate store of data transformed from the operational environment. • Operational update of data does not occur in the data warehouse environment. • Does not require transaction processing, recovery, and concurrency control mechanisms • Requires only two operations in data accessing: • initial loading of data and access of data.
Data Warehouse vs. Heterogeneous DBMS • Traditional heterogeneous DB integration: • Build wrappers/mediators on top of heterogeneous databases • Query driven approach • When a query is posed to a client site, a meta-dictionary is used to translate the query into queries appropriate for individual heterogeneous sites involved, and the results are integrated into a global answer set • Data warehouse: update-driven, high performance • Information from heterogeneous sources is integrated in advance and stored in warehouses for direct query and analysis
Data Warehouse vs. Operational DBMS • OLTP (on-line transaction processing) • Major task of traditional relational DBMS • Day-to-day operations: purchasing, inventory, banking, manufacturing, payroll, registration, accounting, etc. • OLAP (on-line analytical processing) • Major task of data warehouse system • Data analysis and decision making • Distinct features (OLTP vs. OLAP): • User and system orientation: customer vs. market • Data contents: current, detailed vs. historical, consolidated • Database design: ER + application vs. star + subject • View: current, local vs. evolutionary, integrated • Access patterns: update vs. read-only but complex queries
Why Separate Data Warehouse? • High performance for both systems • DBMS— tuned for OLTP: access methods, indexing, concurrency control, recovery • Warehouse—tuned for OLAP: complex OLAP queries, multidimensional view, consolidation. • Different functions and different data: • missing data: Decision support requires historical data which operational DBs do not typically maintain • data consolidation: DS requires consolidation (aggregation, summarization) of data from heterogeneous sources • data quality: different sources typically use inconsistent data representations, codes and formats which have to be reconciled
Chapter 2: Data Warehousing and OLAP Technology for Data Mining • What is a data warehouse? • A multi-dimensional data model • Data warehouse architecture • Data warehouse implementation • Further development of data cube technology • From data warehousing to data mining
Conceptual Modeling of Data Warehouses • Modeling data warehouses: dimensions & measures • Star schema: A fact table in the middle connected to a set of dimension tables • Snowflake schema: A refinement of star schema where some dimensional hierarchy is normalized into a set of smaller dimension tables, forming a shape similar to snowflake • Fact constellations: Multiple fact tables share dimension tables, viewed as a collection of stars, therefore called galaxy schema or fact constellation
item time item_key item_name brand type supplier_type time_key day day_of_the_week month quarter year location branch location_key street city province_or_street country branch_key branch_name branch_type Example of Star Schema Sales Fact Table time_key item_key branch_key location_key units_sold dollars_sold avg_sales Measures
supplier item time item_key item_name brand type supplier_key supplier_key supplier_type time_key day day_of_the_week month quarter year city location branch city_key city province_or_street country location_key street city_key branch_key branch_name branch_type Example of Snowflake Schema Sales Fact Table time_key item_key branch_key location_key units_sold dollars_sold avg_sales Measures
item time item_key item_name brand type supplier_type time_key day day_of_the_week month quarter year location location_key street city province_or_street country shipper branch shipper_key shipper_name location_key shipper_type branch_key branch_name branch_type Example of Fact Constellation Shipping Fact Table time_key Sales Fact Table item_key time_key shipper_key item_key from_location branch_key to_location location_key dollars_cost units_sold units_shipped dollars_sold avg_sales Measures
A Concept Hierarchy: Dimension (location) all all Europe ... North_America region Germany ... Spain Canada ... Mexico country Vancouver ... city Frankfurt ... Toronto L. Chan ... M. Wind office
From Tables and Spreadsheets to Data Cubes • A data warehouse is based on a multidimensional data model which views data in the form of a data cube • A data cube, such as sales, allows data to be modeled and viewed in multiple dimensions • Dimension tables, such as item (item_name, brand, type), or time(day, week, month, quarter, year) • Fact table contains measures (such as dollars_sold) and keys to each of the related dimension tables • In data warehousing literature, an n-D base cube is called a base cuboid. The top most 0-D cuboid, which holds the highest-level of summarization, is called the apex cuboid. The lattice of cuboids forms a data cube.
Multidimensional Data • Sales volume as a function of product, month, and region Dimensions: Product, Location, Time Hierarchical summarization paths Region Industry Region Year Category Country Quarter Product City Month Week Office Day Product Month
Date 2Qtr 1Qtr sum 3Qtr 4Qtr TV Product U.S.A PC VCR sum Canada Country Mexico sum All, All, All A Sample Data Cube Total annual sales of TV in U.S.A.
Cuboids Corresponding to the Cube all 0-D(apex) cuboid country product date 1-D cuboids product,date product,country date, country 2-D cuboids 3-D(base) cuboid product, date, country
Browsing a Data Cube • Visualization • OLAP capabilities • Interactive manipulation
Typical OLAP Operations • Roll up (drill-up): summarize data • by climbing up hierarchy or by dimension reduction • Drill down (roll down): reverse of roll-up • from higher level summary to lower level summary or detailed data, or introducing new dimensions • Slice and dice: • project and select • Pivot (rotate): • reorient the cube, visualization, 3D to series of 2D planes. • Other operations • drill across: involving (across) more than one fact table • drill through: through the bottom level of the cube to its back-end relational tables (using SQL)
Chapter 2: Data Warehousing and OLAP Technology for Data Mining • What is a data warehouse? • A multi-dimensional data model • Data warehouse architecture • Data warehouse implementation • Further development of data cube technology • From data warehousing to data mining
other sources Extract Transform Load Refresh Operational DBs Multi-Tiered Architecture Monitor & Integrator OLAP Server Metadata Analysis Query Reports Data mining Serve Data Warehouse Data Marts Data Sources Data Storage OLAP Engine Front-End Tools
OLAP Server Architectures • Relational OLAP (ROLAP) • Use relational or extended-relational DBMS to store and manage warehouse data and OLAP middleware • Include optimization of DBMS backend, implementation of aggregation navigation logic, and additional tools and services • greater scalability • Multidimensional OLAP (MOLAP) • Array-based multidimensional storage engine (sparse matrix techniques) • fast indexing to pre-computed summarized data • Hybrid OLAP (HOLAP) • User flexibility, e.g., low level: relational, high-level: array • Specialized SQL servers • specialized support for SQL queries over star/snowflake schemas
Chapter 2: Data Warehousing and OLAP Technology for Data Mining • What is a data warehouse? • A multi-dimensional data model • Data warehouse architecture • Data warehouse implementation • Further development of data cube technology • From data warehousing to data mining
Efficient Data Cube Computation • Data cube can be viewed as a lattice of cuboids • The bottom-most cuboid is the base cuboid • The top-most cuboid (apex) contains only one cell • How many cuboids in an n-dimensional cube?
Problem: How to Implement Data Cube Efficiently? • Physically materialize the whole data cube • Space consuming in storage and time consuming in construction • Indexing overhead • Materialize nothing • No extra space needed but unacceptable response time • Materialize only part of the data cube • Intuition: precompute frequently-asked queries? • However: each cell of data cube is an aggregation, the value of many cells are dependent on the values of other cells in the data cube • A better approach: materialize queries which can help answer many other queries quickly
An motivating example • Assume the data cube: • Stored in a relational DB (MDDB is not very scalable) • Different cuboids are assigned to different tables • The cost of answering a query is proportional to the number of rows examined • Use TPC-D decision-support benchmark • Attributes: part, supplier, and customer • Measure: total sales • 3-D data cube: cell (p, s ,c)
An motivating example (cont.) • Hypercube lattice: the eight views (cuboids) constructed by grouping on some of part, supplier, and customer Finding total sales grouped by part • Processing 6 million rows if cuboid pc is materialized • Processing 0.2 million rows if cuboid p is materialized • Processing 0.8 million rows if cuboid ps is materialized
An motivating example (cont.) How to find a good set of views? • How many views must be materialized to get reasonable performance? • Given space S, what views should be materialized to get the minimal average query cost? • If we are willing to tolerate an X% degradation in average query cost from a fully materialized data cube, how much space can we save over the fully materialized data cube?
Dependence relation The dependence relation on queries: • Q1 _ Q2 iff Q1 can be answered using only the results of query Q2 (Q1 is dependent on Q2). In which • _ is a partial order, and • There is a top element, a view upon which all queries are dependent (base cuboid) • Example: • (part) _ (part, customer) • (part) _ (customer) and (customer) _ (part)
Lattice notation • A lattice with set of elements L and dependance relation _ is denoted by <L, _> • a b means that a _ b, and a ¹ b • ancestor(a) = {b | a _ b } • descendant(a) = {b | b _ a } • next(a) = {b | a b, $ c, a c , c b} • Lattice diagrams: a lattice can be represented as a graph, where the lattice elements (views) are nodes and there is an edge from a below b iff b is in next(a).
The advantages of lattice framework • Provide a clean framework to reason with dimensional hierarchies • We can model the common queries asked by users better • Tells us in what order to materialize the views
The linear cost model • For <L, _>, Q _ QA, C(Q) is the number of rows required to construct Q in QA • Assume all queries are full views: i.e., identical to some element (view) in the given lattice • T = m * S + c (m: time/size ratio; c: query overhead; S can be estimated by sampling and analytical methods)
The benefit of a materialized view • Denote the benefit of a materialized view v, relative to some set of views S, as B(v, S) • For each w _ v, define BW by: • Let C(v) be the cost of view v • Let u be the view of least cost in S such that w _ u (such S must exist) • BW = C(u) – C(v) if C(v) < C(u) = 0 if C(v) ≥ C(u) • BW is the benefit that it can obtain from v • Define B(v, S) = Σ w < vBw, means how v can improve the cost of evaluating views, including itself
The greedy algorithm • Objective • Assume materializing a fixed number of views, regardless of the space they use • How to minimize the average time taken to evaluate a view? • The greedy algorithm for materializing a set of k views • Performance: Greedy/Optimal ≥ 1 – (1 – 1/k) k ≥ (e - 1) / e
Greedy algorithm example 1 • Suppose we want to choose three views (k = 3) • The selection is optimal (reduce cost from 800 to 420)
Greedy algorithm example 2 • Suppose k = 2 • Greedy algorithm picks c and b, benefit = 101*41+100*21 = 6241 • Optimal selection is b and d benefit = 100*41+100*41 = 8200 • However, greedy/optimal = 6241/8200 > 3/4
Number of materialized views An experiment: how many views should be materialized? • Time and space for the greedy selection for the TPC-D-based example (full materialization is not efficient)
Efficient Processing of OLAP Queries • Determine which operations should be performed on the available cuboids: • transform drill, roll, etc. into corresponding SQL and/or OLAP operations, e.g, dice = selection + projection • Determine to which materialized cuboid(s) the relevant operations should be applied. • Exploring indexing structures and compressed vs. dense array structures in MOLAP
Metadata Repository • Meta data is the data defining warehouse objects. It has the following kinds • Description of the structure of the warehouse • schema, view, dimensions, hierarchies, derived data defn, data mart locations and contents • Operational meta-data • data lineage (history of migrated data and transformation path), currency of data (active, archived, or purged), monitoring information (warehouse usage statistics, error reports, audit trails) • The algorithms used for summarization • The mapping from operational environment to the data warehouse • Data related to system performance • warehouse schema, view and derived data definitions • Business data • business terms and definitions, ownership of data, charging policies
Data Warehouse Back-End Tools and Utilities • Data extraction: • get data from multiple, heterogeneous, and external sources • Data cleaning: • detect errors in the data and rectify them when possible • Data transformation: • convert data from legacy or host format to warehouse format • Load: • sort, summarize, consolidate, compute views, check integrity, and build indicies and partitions • Refresh • propagate the updates from the data sources to the warehouse
Chapter 2: Data Warehousing and OLAP Technology for Data Mining • What is a data warehouse? • A multi-dimensional data model • Data warehouse architecture • Data warehouse implementation • Further development of data cube technology • From data warehousing to data mining
Discovery-Driven Exploration of Data Cubes • Hypothesis-driven: exploration by user, huge search space • Discovery-driven (Sarawagi et al.’98) • pre-compute measures indicating exceptions, guide user in the data analysis, at all levels of aggregation • Exception: significantly different from the value anticipated, based on a statistical model • Visual cues such as background color are used to reflect the degree of exception of each cell • Computation of exception indicator (modeling fitting and computing SelfExp, InExp, and PathExp values) can be overlapped with cube construction
Complex Aggregation at Multiple Granularities: Multi-Feature Cubes • Multi-feature cubes (Ross, et al. 1998): Compute complex queries involving multiple dependent aggregates at multiple granularities • Ex. Grouping by all subsets of {item, region, month}, find the maximum price in 1997 for each group, and the total sales among all maximum price tuples select item, region, month, max(price), sum(R.sales) from purchases where year = 1997 cube by item, region, month: R such that R.price = max(price) • Continuing the last example, among the max price tuples, find the min and max shelf life, and find the fraction of the total sales due to tuple that have min shelf life within the set of all max price tuples
Chapter 2: Data Warehousing and OLAP Technology for Data Mining • What is a data warehouse? • A multi-dimensional data model • Data warehouse architecture • Data warehouse implementation • Further development of data cube technology • From data warehousing to data mining
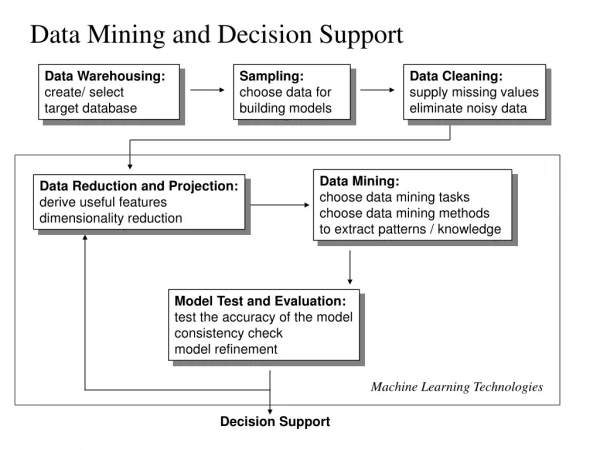
Data Warehouse Usage • Three kinds of data warehouse applications • Information processing • supports querying, basic statistical analysis, and reporting using crosstabs, tables, charts and graphs • Analytical processing • multidimensional analysis of data warehouse data • supports basic OLAP operations, slice-dice, drilling, pivoting • Data mining • knowledge discovery from hidden patterns • supports associations, constructing analytical models, performing classification and prediction, and presenting the mining results using visualization tools. • Differences among the three tasks