Download
1 / 1
10 likes | 125 Views
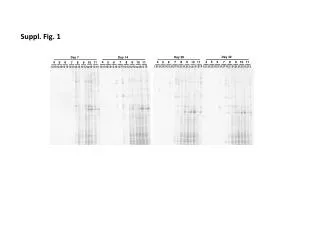
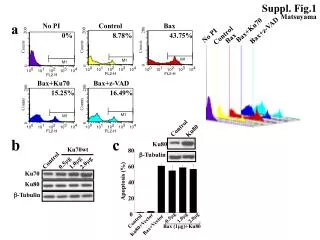
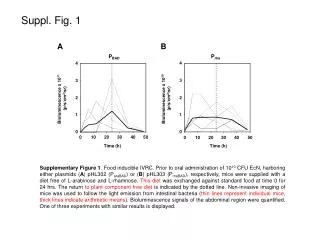
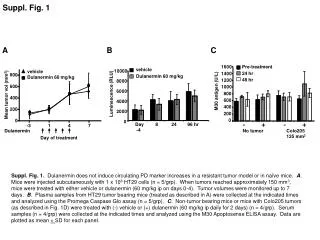
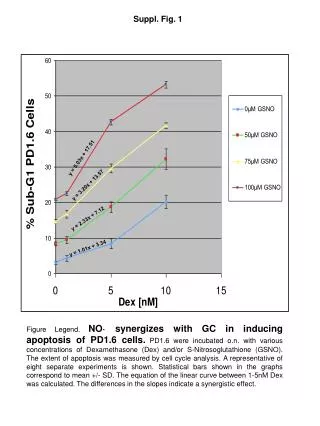
This study investigates the synergistic effects of Dexamethasone (Dex) and S-Nitrosoglutathione (GSNO) on the apoptosis of PD1.6 cells. Incubation with varying concentrations of Dex and/or GSNO was conducted, and apoptosis levels were determined through cell cycle analysis. A representative dataset from eight separate experiments illustrates these findings. Graphs include statistical bars representing mean ± SD. The calculated linear equations (y = 5.03x + 17.51, etc.) demonstrate that the differences in slopes reflect a significant synergistic interaction between the compounds in inducing apoptosis.

E N D
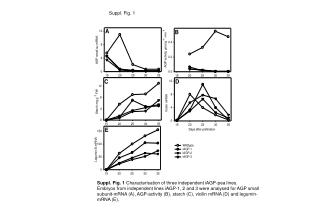
Suppl. Fig. 1 y = 5.03x + 17.51 y = 3.20x + 13.57 y = 2.33x + 7.12 y = 1.01x + 3.34 Figure Legend. NO· synergizes with GC in inducing apoptosis of PD1.6 cells. PD1.6 were incubated o.n. with various concentrations of Dexamethasone (Dex) and/or S-Nitrosoglutathione (GSNO). The extent of apoptosis was measured by cell cycle analysis. A representative of eight separate experiments is shown. Statistical bars shown in the graphs correspond to mean +/- SD. The equation of the linear curve between 1-5nM Dex was calculated. The differences in the slopes indicate a synergistic effect.