1 / 1

Supplementary Figure 1. Representative PCR amplification plots and standard curves .

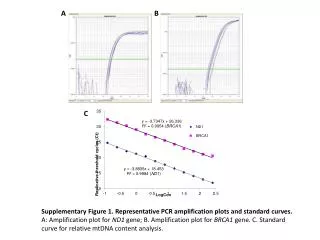
B. A. C. Supplementary Figure 1. Representative PCR amplification plots and standard curves . A : Amplification plot for ND1 gene; B. Amplification plot for BRCA1 gene. C. Standard curve for relative mtDNA content analysis.

sasha
Download Presentation

Supplementary Figure 1. Representative PCR amplification plots and standard curves .

An Image/Link below is provided (as is) to download presentation Download Policy: Content on the Website is provided to you AS IS for your information and personal use and may not be sold / licensed / shared on other websites without getting consent from its author. Content is provided to you AS IS for your information and personal use only. Download presentation by click this link. While downloading, if for some reason you are not able to download a presentation, the publisher may have deleted the file from their server. During download, if you can't get a presentation, the file might be deleted by the publisher.

E N D

Presentation Transcript


  1. B A C Supplementary Figure 1. Representative PCR amplification plots and standard curves. A: Amplification plot for ND1 gene; B. Amplification plot for BRCA1 gene. C. Standard curve for relative mtDNA content analysis. Supplementary Figure 1. Representative PCR amplification plots and standard curves. A: Amplification plot for ND1 gene; B. Amplification plot for BRCA1 gene. C. Standard curve for relative mtDNA content analysis.

More Related