Student PCR Analysis: Amplification Plots and Dissociation Curves for 10 Experiments
Explore the PCR results of 10 student experiments through amplification plots and dissociation curves. Compare data and identify trends for each student. Enhance understanding of genomic analysis techniques.

Student PCR Analysis: Amplification Plots and Dissociation Curves for 10 Experiments
E N D
Presentation Transcript
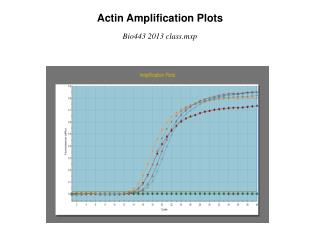
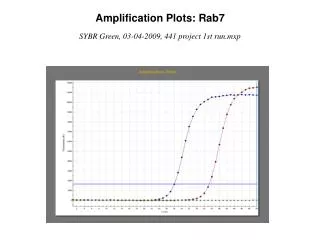
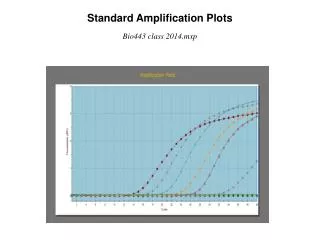
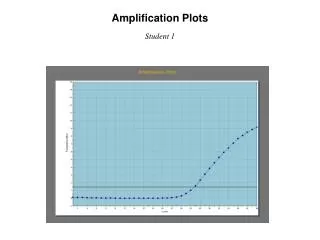
Amplification Plots Student 1
Dissociation Curve Student 1
Amplification Plots Student 2
Dissociation Curve Student 2
Amplification Plots Student 3
Dissociation Curve Student 3
Amplification Plots Student 4
Dissociation Curve Student 4
Amplification Plots Student 5
Dissociation Curve Student 5
Amplification Plots Student 6
Dissociation Curve Student 6
Amplification Plots Student 7
Dissociation Curve Student 7
Amplification Plots Student 8
Dissociation Curve Student 8
Amplification Plots Student 9
Dissociation Curve Student 9
Amplification Plots Student 10
Dissociation Curve Student 10