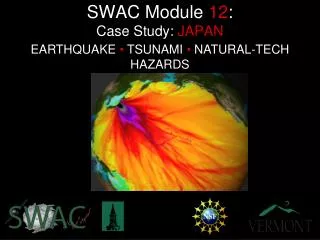
SWAC Module 12 : Case Study: JAPAN
EARTHQUAKE • TSUNAMI • NATURAL-TECH HAZARDS. SWAC Module 12 : Case Study: JAPAN. The islands that comprise Japan are located along a subduction zone between the Eurasian, Pacific, and Phillipine plates.

SWAC Module 12 : Case Study: JAPAN
E N D
Presentation Transcript
EARTHQUAKE • TSUNAMI • NATURAL-TECH HAZARDS SWAC Module 12: Case Study: JAPAN
The islands that comprise Japan are located along a subduction zone between the Eurasian, Pacific, and Phillipine plates. As the Pacific Plate slides slowly below the Eurasian Plate, intense pressure develops of large periods of time. This pressure is relieved in the form of earthquakes: Plate Tectonics
Earthquake Remote Sensing SCIGN- Southern California Integrated GPS Network • Deploy a network of sophisticated GPS devices • Measure exact <1cm Geographic Position • Observe changes over time
InSAR Interferometric Synthetic Aperture Radar • “Actively” send RADAR signal towards ground • OUTGOING phase of wave is known • Signal hits Earth and is reflected back to space • INCOMING phase is recorded • Process is repeated over a time series Differences in phases of same area over time reveal changes in ground surface. Each {STRIPE} of colors represents a change in surface height
More on inSAR 1 Fringe = +/- 3 cm deformation
Tsunamis Tsunamis are caused by rapid displacement of water by mass movement of material. They are often caused by Earthquakes, but can also be caused by volcanic eruptions, landslides, etc. Tsunamis are not restricted to oceans - they can occur wherever large volumes of water can be rapidly displaced. Animated Tsunami Formation
The NOAA Dart System (Deep Ocean Reporting of Tsunami) is composed of floating surface buoys that are tethered to stationary ocean floor sensors. These couplings are strategically placed throughout oceans in locations that allow Tsunamis to be detected in sufficient time to permit the evacuation of coastal areas. Tsunami Monitoring and Warning
LiDAR Mapping Use high precision ( x < 1 cm) data to model inundation scenarios. Help predict flood situations and allow advanced planning for municipalities
Remote Damage Assessment Satellites offer the ability to capture imagery of dangerous areas… In this case they are assessing an area that has radiation levels too high for human inspection. Modern sensors are able to capture images at the <1’ level.
One Bq (Bequerel) is defined as the activity of a quantity of radioactive material in which one nucleus decays per second Radioactive Release US EPA maintains an updated database (RADNET) of radioactive contaminants in the US
Plume Modeling • What, how much, and where was released • Strength of the release (or in most cases blast) • Detailed wind and weather information Radioactive Plume Dispersion similar to standard Air Pollution EXCEPT: FALLOUT of particles travelling in plume have SIGNIFICANTLY more serious effects on health.
Long Term Monitoring Perspective Chernobyl Landsat images from 1986 and 1992 show extensive changes in vegetation after disaster in 1986… 1986