Experimental Design Diagram
100 likes | 507 Views
Experimental Design Diagram. Title: The Effect of Isolation on the Genes in a Population Hypothesis: If two populations become isolated then….. Independent Variable: Interbreeding vs Isolated Populations and Time Levels of Independent Variable Generations 1-5

Experimental Design Diagram
E N D
Presentation Transcript
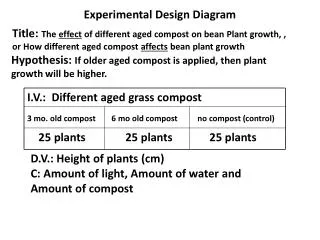
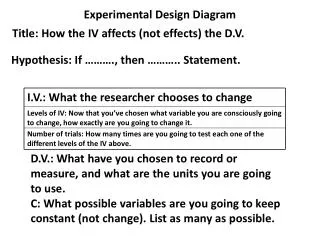
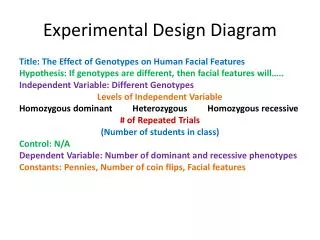
Experimental Design Diagram Title: The Effect of Isolation on the Genes in a Population Hypothesis: If two populations become isolated then….. Independent Variable: Interbreeding vs Isolated Populations and Time Levels of Independent Variable Generations 1-5 # of Repeated Trials 5 Per Population Control: Interbreeding Population Dependent Variable: Percent of Genotypes AA, Aa, and aa Constants: Gene letters (alleles), breeding time, recombination times
Materials Needed: 1. Four cards (2 A’s and 2 a’s) 2. Paired desks 3. Data Sheet 4. Music Procedure Outline: 1. Record your Initial Genotype as Aa 2. Taking your cards and your data sheet with you, move around the desks as directed when the music starts. 3. Quickly find a seat when the music stops. 4. Shuffle your cards. 5. Each person of the pair lays down one card. 6. The person on the right records that genotype in Round 1. 7. Shuffle the cards again and repeat the process for the person on the left. 8. If your new genotype is Aa, keep 2 A and 2 a cards. If your genotype is AA, you will need 4 A cards. If your genotype is aa, you will need 4 a cards. 9.Repeat steps 2-7 for a total of 5 rounds. 10. Repeat the entire process for two isolated populations. 11. Determine the percent of each genotype at the end of the 5th round for each population. Fill in the data tables, then make a graph.
Conclusion: • Summarize the data and state whether or not it supports your hypothesis. • Explain why you think it turned out the way it did. • Explain some way that this data could be useful to someone? • Give an example of another experiment we could do to show how speciation occurs. • What could we have done to improve on this activity?