Experimental Design Diagram
30 likes | 312 Views
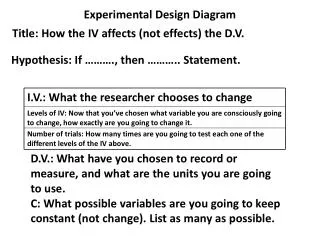
Experimental Design Diagram. Title: How the IV affects (not effects) the D.V. Hypothesis: If ………., then ……….. Statement. I.V.: What the researcher chooses to change. Levels of IV: Now that you’ve chosen what variable you are consciously going to change, how exactly are you going to change it.

Experimental Design Diagram
E N D
Presentation Transcript
Experimental Design Diagram Title: How the IV affects (not effects) the D.V. Hypothesis: If ………., then ……….. Statement. I.V.: What the researcher chooses to change Levels of IV: Now that you’ve chosen what variable you are consciously going to change, how exactly are you going to change it. Number of trials: How many times are you going to test each one of the different levels of the IV above. D.V.: What have you chosen to record or measure, and what are the units you are going to use. C: What possible variables are you going to keep constant (not change). List as many as possible.
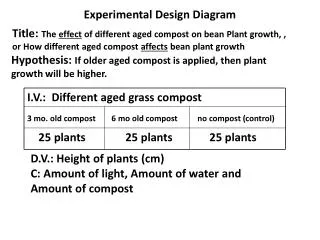
Experimental Design Diagram (Example) Title: How different brands of paper towels affects how much water they absorb. Hypothesis: If I test different brands of paper towels, then Bounty paper towels will absorb the most water. I.V.: Different Brands of Paper Towels Bounty Brawny Sparkle Viva Scott Canterbury 10 10 10 10 10 10 D.V.: Amount of water absorbed (ml) C: Size of towel, Amount of water tested, size of beaker, tap water, time submerged, size of graduated cylinder, etc………..