Download
1 / 22
220 likes | 328 Views
Validation of NOP58 and RBFOX2 knockdowns by qPCR, bioanalysis of RNA sequencing libraries, abundance patterns of snoRNAs, identification of snoRNA classes, and validation of snoRNA forms using northern blot analysis in SKOV3ip1 ovarian cancer cells.

E N D
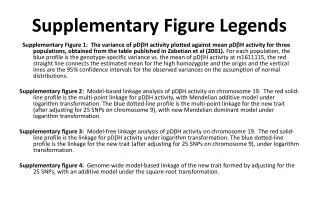
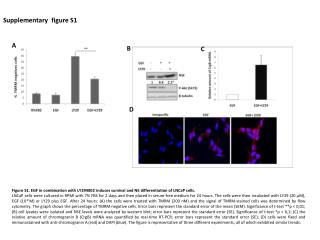
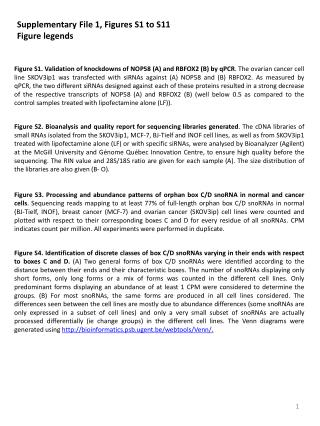
Supplementary File 1, Figures S1 to S11 Figure legends Figure S1. Validation of knockdowns of NOP58 (A) and RBFOX2 (B) by qPCR. The ovarian cancer cell line SKOV3ip1 was transfected with siRNAs against (A) NOP58 and (B) RBFOX2. As measured by qPCR, the two different siRNAs designed against each of these proteins resulted in a strong decrease of the respective transcripts of NOP58 (A) and RBFOX2 (B) (well below 0.5 as compared to the control samples treated with lipofectamine alone (LF)). Figure S2. Bioanalysis and quality report for sequencing libraries generated. The cDNA libraries of small RNAs isolated from the SKOV3ip1, MCF-7, BJ-Tielf and INOF cell lines, as well as from SKOV3ip1 treated with lipofectamine alone (LF) or with specific siRNAs, were analysed by Bioanalyzer (Agilent) at the McGill University and Génome Québec Innovation Centre, to ensure high quality before the sequencing. The RIN value and 28S/18S ratio are given for each sample (A). The size distribution of the libraries are also given (B- O). Figure S3. Processing and abundance patterns of orphan box C/D snoRNAin normal and cancer cells. Sequencing reads mapping to at least 77% of full-length orphan box C/D snoRNAs in normal (BJ-Tielf, INOF), breast cancer (MCF-7) and ovarian cancer (SKOV3ip) cell lines were counted and plotted with respect to their corresponding boxes C and D for every residue of all snoRNAs. CPM indicates count per million. All experiments were performed in duplicate. Figure S4. Identification of discrete classes of box C/D snoRNAs varying in their ends with respect to boxes C and D. (A) Two general forms of box C/D snoRNAs were identified according to the distance between their ends and their characteristic boxes. The number of snoRNAsdisplaying only short forms, only long forms or a mix of forms was counted in the different cell lines. Only predominant forms displaying an abundance of at least 1 CPM were considered to determine the groups. (B) For most snoRNAs, the same forms are produced in all cell lines considered. The differences seen between the cell lines are mostly due to abundance differences (some snoRNAs are only expressed in a subset of cell lines) and only a very small subset of snoRNAs are actually processed differentially (ie change groups) in the different cell lines. The Venn diagrams were generated using http://bioinformatics.psb.ugent.be/webtools/Venn/.
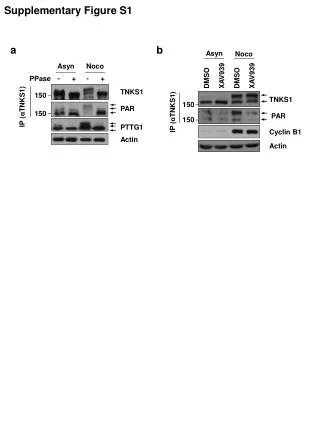
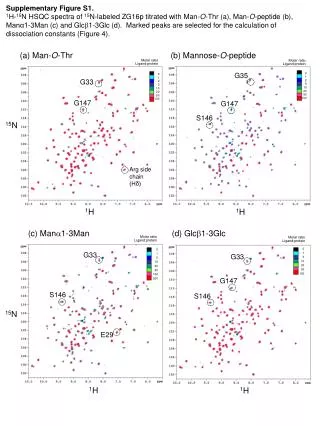
Figure S5. Validation of snR39B forms and their response to RBFOX2 and NOP58 knockdown. (A) The distribution of the different forms of snR39B detected by sequencing. The abundance of the different forms generated from snR39B was determined before and after the knockdown of either NOP58 or RBFOX2 and plotted relative to the number of the nucleotides upstream of box C and downstream of box D. CPM, SI and LF respectively indicate counts per million reads mapped, siRNA knockdown and mock transfection (Lipofectamine). The data obtained after the transfection of two independent siRNA targeting either NOP58 (blue bars) or RBFOX2 (red bars) and three mock transfections (black bars) are shown. (B) Northern blot analysis of snoRNA snR39B. Total RNA was extracted from SKOV3ip1 after mock transfection using Lipofectamine (LF) or after transfection of two different siRNAs (KD_1 and KD_2) targeting RBFOX2 or NOP58 and separated using PAGE. The different species of snoRNA were identified using a probe complementary to the mature sequence of snR39B. The 5S and 5.8S rRNA are shown as loading control. The position of a DNA size marker (M) is indicated on the left, while the position of the long and short forms identified in A is indicated by arrows. The percent long (L) calculated as 100*L/(L+SH) is shown at bottom. The data are the average of two experiments and the standard deviation is shown below the percent long. Figure S6. Validation of U31 expression and its response to RBFOX2 and NOP58 knockdown. (A) The distribution of the different forms of U31 detected by sequencing. The abundance of the different forms generated from U31 was determined before and after the knockdown of either NOP58 or RBFOX2 and plotted relative to the number of the nucleotides upstream of box C and downstream of box D. CPM, SI and LF respectively indicate counts per million reads mapped, siRNA knockdown and mock transfection (Lipofectamine). The data obtained after the transfection of two independent siRNA targeting either NOP58 (blue bars) or RBFOX2 (red bars) and three mock transfections (black bars) are shown. (B) Northern blot analysis of snoRNA U31. Total RNA was extracted from SKOV3ip1 after mock transfection using Lipofectamine (LF) or after transfection of two different siRNAs(KD_1 and KD_2) targeting RBFOX2 or NOP58 and separated using PAGE. The RNA was visualized using a probe complementary to the mature sequence of U31. The position of a DNA size marker (M) is indicated on the left, while the position of U31 is indicated by an arrow. The expression level of U31 before and after knockdown was determined using quantitative RT-PCR and the expression levels relative to that detected in mock transfected cells are indicated at bottom. Figure S7. Predicted stability of different snoRNA forms of U15B (A-C), U26 (D-F) and SNORD126 (G-I) as analyzed using mfold. The three snoRNAs expressed as both long and short forms and showing the strongest effect in the NOP58 knockdown (long forms) and the RBFOX2 knockdown (short forms) were evaluated using mfold (http://mfold.rna.albany.edu/?q=mfold/RNA-Folding-Form). For each snoRNA, the predicted minimum free energy of the long form with secondary structure most likely to form a k-turn (as evaluated by visual inspection) was compared to the short form showing strongest canonical base pairing in the terminal region and the short form most likely to form a k-turn. Constraints (as described on the RNA folding form of the mfold web server and in the corresponding manuscript (Zuker (2003) NAR 31(13):3406-15)) were used to force base pairing of certain residues (in particular to force short forms to adopt a structure compatible with k-turn formation), in order to compare the minimum free energy of each form type. The boxes C and D are highlighted in orange and blue respectively for each structure. It should be noted that mfold does not predict non-canonical G-A and A-G base pairing found in k-turns and thus the actual minimum free energy of the k-turn forms is likely to be lower than the mfold predicted values.
Figure S8. Box C/D snoRNA forms most affected by NOP58 depletion. All snoRNA forms negatively affected by at least two-fold in the NOP58 depletions as compared to the lipofectamine (LF) control samples are listed. Figure S9. Box C/D snoRNA forms most affected by RBFOX2 depletion. All snoRNA forms negatively affected by at least two-fold in the RBFOX2 depletions as compared to the lipofectamine (LF) control samples are listed. Figure S10. Intronic position and stem length preference of snoRNAs affected by the NOP58 and RBFOX2 depletions. The snoRNA end and stem lengths as well as position of the snoRNA within its host intron (i.e. distance separating the snoRNA from the closest downstream exon) were determined for snoRNAs with at least one form affected by either NOP58 (left column) or RBFOX2 (right column) and presented in the form of pie charts. The snoRNAs considered for this analysis are those listed in Figures S8 and S9. Figure S11. RBFOX2 directly binds to box C/D snoRNAs. RBFOX2 CLIP-seq reads mapping to all positions of the repeat-masked human genome were obtained from the UCSC Genome Browser, ‘FOX2 adaptor-trimmed CLIP-seq reads’ regulation track, and hg18 build. Reads mapping to coding genes, miRNAs and box C/D snoRNAs were intersected with the FOX2 CLIP-seq reads to determine the highest read count per position for each molecule. These maximum read counts were binned and their distribution is shown for each class of molecule. As seen in the graph, very low counts of miRNA reads were identified in the RBFOX2 CLIP-seq dataset. A larger proportion of UCSC genes were found bound by RBFOX2, with 7% of transcripts displaying more than 10 reads overlapping the same position. Finally, even though their length is much shorter than those of protein-coding transcripts, a strong proportion of box C/D snoRNAs were found bound by RBFOX2, with 40% of box C/D snoRNAs displaying more than 10 reads overlapping the same position.
A LF NOP58 SI1 NOP58 SI2 B LF RBFOX2 SI1 RBFOX2 SI2 Figure S1. Validation of knockdowns of NOP58 (A) and RBFOX2 (B) by qPCR. Deschamps-Francoeur et al., 2014
A B SKOV3ip1_1 Figure S2. Bioanalysis and quality report for RNAseq datasets generated. Deschamps-Francoeur et al., 2014
C SKOV3ip1_2 D MCF-7_2 E MCF-7_2 Figure S2 (continued). Bioanalysis and quality report for RNAseq datasets generated Deschamps-Francoeur et al., 2014
F BJ-Tielf_1 G BJ-Tielf_2 H INOF_1 Figure S2 (continued). Bioanalysis and quality report for RNAseq datasets generated. Deschamps-Francoeur et al., 2014
I INOF_2 J SKOV3ip1_LF_1 K SKOV3ip1_LF_2 Figure S2 (continued). Bioanalysis and quality report for RNAseq datasets generated. Deschamps-Francoeur et al., 2014
L SKOV3ip1_LF_3 M SKOV3ip1_NOP58_KD_1 N SKOV3ip1_NOP58_KD_2 Figure S2 (continued). Bioanalysis and quality report for RNAseq datasets generated. Deschamps-Francoeur et al., 2014
N SKOV3ip1_RBFOX2_KD_1 O SKOV3ip1_RBFOX2_KD_2 Figure S2 (continued). Bioanalysis and quality report for RNAseq datasets generated. Deschamps-Francoeur et al., 2014
Abundance in CPM Abundance in CPM Figure S3. Processing and abundance patterns of orphan box C/D snoRNA in normal and cancer cells. Deschamps-Francoeur et al., 2014
A U106 U15B HBII-295 B snoRNAs produced with both short and long ends snoRNAs produced only with short ends snoRNAs produced only with long ends Figure S4. Identification of discrete classes of box C/D snoRNAs varying in their ends with respect to boxes C and D. Deschamps-Francoeur et al., 2014
A snR39B snR39BL snR39BSH LF1 LF2 LF3 NOP58 SI1 Abundance in CPM NOP58 SI2 RBFOX2 SI1 RBFOX2 SI2 Number of nucleotides upstream of box C : Number of nucleotides downstream of box D B RBFOX2 KD NOP58 KD LF M SI1 SI2 SI1 SI2 75 70 65 snR39BL snR39BSH 5.8S rRNA 5S rRNA % Long 37.7 35.2 34.4 19.9 17.9 ± 0.4 ± 2.9 ± 0.7 ± 0.8 ± 5.6 Figure S5. Validation of snR39B forms and their response to RBFOX2 and NOP58 knockdown. Deschamps-Francoeur et al., 2014
A U31 LF1 LF2 LF3 Abundance in CPM NOP58 SI1 NOP58 SI2 RBFOX2 SI1 RBFOX2 SI2 Number of nucleotides upstream of box C : Number of nucleotides downstream of box D B RBFOX2 KD NOP58 KD M LF SI1 SI2 SI1 SI2 75 70 65 U31 1.0 0.60 0.40 0.6 0.42 Relative Expression Figure S6. Validation of U31 expression and its response to RBFOX2 and NOP58 knockdown. Deschamps-Francoeur et al., 2014
A B C U15B long form (k-turn forming) (ΔG = -44.20 kcal/mol) U15B short k-turn form (ΔG = -39.60 kcal/mol) U15B short form, canonical pairing in terminal region (ΔG = -43.90 kcal/mol) Figure S7. Stability of different snoRNA forms of U15B (A-C), U26 (D-F) and SNORD126 (G-I) as analyzed using mfold. Deschamps-Francoeur et al., 2014
D E U26 long form (k-turn forming) (ΔG = -8.50 kcal/mol) U26 short k-turn form (ΔG = -4.40 kcal/mol) F U26 short form, canonical pairing in terminal region (ΔG = -6.23 kcal/mol) Figure S7 (continued). Stability of different snoRNA forms of U15B (A-C), U26 (D-F) and SNORD126 (G-I) as analyzed using mfold. Deschamps-Francoeur et al., 2014
C G H SNORD126 short k-turn form (ΔG = -8.50 kcal/mol) SNORD126 long form (k-turn forming) (ΔG = -11.50 kcal/mol) I SNORD126 short form, canonical pairing in terminal region (ΔG = -10.40 kcal/mol) Figure S7 (continued). Stability of different snoRNA forms of U15B (A-C), U26 (D-F) and SNORD126 (G-I) as analyzed using mfold. Deschamps-Francoeur et al., 2014
Figure S8. Box C/D snoRNA forms most affected by NOP58 depletion (NOP58 KD/LF abundance fold change < 0.5) Deschamps-Francoeur et al., 2014
Figure S8 (continued). Box C/D snoRNA forms most affected by NOP58 depletion (NOP58 KD/LF abundance fold change < 0.5) Deschamps-Francoeur et al., 2014
Figure S9 (continued). Box C/D snoRNA forms most affected by RBFOX2 depletion (RBFOX2 KD/LF abundance fold change < 0.5) Deschamps-Francoeur et al., 2014
short form long form other > 4 base pairs <= 4 base pairs <150 nt from downstream exon >=150 nt from downstream exon Figure S10. Intronic position and stem length preference of snoRNAs most affected by the NOP58 and RBFOX2 depletions. Deschamps-Francoeur et al., 2014
Figure S11. RBFOX2 directly binds to box C/D snoRNAs Deschamps-Francoeur et al., 2014