Download
1 / 72
720 likes | 836 Views
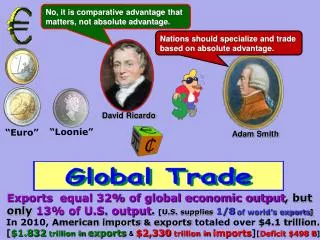
Ch. 4: Resources, Comparative Advantage, and Income Distribution. Evolution of Trade Theories. Adam Smith used differences in labor productivity to explain why trade occurs.

E N D
Ch. 4: Resources, Comparative Advantage, and Income Distribution
Evolution of Trade Theories • Adam Smith used differences in labor productivity to explain why trade occurs. • Ricardo extended the productivity differences idea to show why trade benefits both the more productive and the less productive countries.
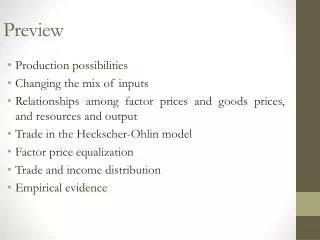
Evolution of Trade Theories • While trade is partly explained by differences in labor productivity, it also can be explained by differences in resources across countries. • The Heckscher-Ohlin theory argues that international differences in labor, labor skills, physical capital or land (factors of production) create productive differences that explain why trade occurs.
Evolution of Trade Theories • Heckscher-Ohlin theory allows for all the factors to be freely employed in every industry. • H-O theory is also called “factor-proportions” theory because it allows different proportions of K/L ratio to be used in the production process. • As new theories are developed, old theories become a special case of the new theory.
Neoclassical Production • In H-O, labor and capital can be substituted to produce a constant unit of output. • Each firm will try produce the highest output with given amount of outlay by changing the proportions of capital and labor used. • Typically, technologies in different industries employ different ratios of capital and labor in spite of the fact that the prices of inputs they face are the same.
Typical Firm Behavior Terrain Terrain Q=3 w/r Q=2 Q=3 Q=2 Q=1 Q=1 Labor Labor FOOD CLOTH
Factor Prices, Factor Proportions • In the previous example, the ratio of wages to rental rate of territory is the same for all the firms in clothing and food. • Firms in food industry use a higher land/labor ratio than firms in clothing. • aLC /aTC > aLF/aTF • Or aLC /aLF > aTC /aTF • Considering the total resources used in each industry, cloth production is labor intensive and food production is land intensive if LC /TC > LF /TF.
Output Prices • Assuming that all the firms operate in competitive environment, their unit cost will be equal to the price they charge.
Increase in r (Cost of Land) T T w/r1 Q=3 w/r2 Q=3 Q=1 Q=1 L CLOTH FOOD L
Increase in r (Cost of Land) • All the firms react to an increase in cost of land the same way: substitute more labor for capital. • Because land is the intensive factor in food, higher cost of land will raise the price of food compared to cloth. • Or labor is relatively cheaper so cloth will be relatively cheaper.
Expansion Path T T Q=3 Q=2 Q=3 Q=2 Q=1 Q=1 L CLOTH FOOD L
PPF • If more food is to be produced, both land and labor will be taken away from cloth. • First, excess land will be taken, resulting in a small drop of cloth production. • As more and more resources are taken away, opportunity cost of food (cloth sacrificed) rises.
What to Produce • PPF shows options given “technology.” • Any point on the PPF is efficient. • How to choose “the” point? • What is the meaning of the slope of PPF? • How to draw a budget line and what does the slope show?
PPF FOOD PC/PF Y/PF Y/PC CLOTH
Change in r • If r increases, w/r falls. • Both industries prefer to lower their Land/Labor ratios (increase L/T ratios). • Since food is land intensive, PF will go up. • What happened to price ratios? Where are we on the PPF? • Why did Food production INCREASE?
Change in r • Why did Food production INCREASE? • What happens to the Marginal Product of Labor if less Land is used (remember Land/Labor (T/L) ratios fell)? • What happens to the Marginal Product of Land if more labor is employed? • What happens to the earnings of labor and landowners?
Allocation of Land and Labor • Given the prices of cloth and food, the competitive economy will choose the point on the PPF where the opportunity cost of cloth in terms of food is Pc/Pf. • Given the price ratios, the relative factor prices are also determined, indicating a specific choice of land/labor ratio for each industry.
Allocation of Labor and Land L 0 Labor in Cloth T C l o t h F o o d The slope is the Land/Labor ratio for Food. T 0 Labor in Food L
Increase in Land L 0 Labor in Cloth T C L O T H F O O D T 0 L Labor in Food
Increase in Land • More land in this country will make food industry employ both more labor and land. • If prices of food relative to cloth remained the same, keeping factor prices and factor proportions the same, food sector (land-intensive) will expand and cloth sector (labor-intensive) will shrink.
Relative Product Prices and Relative Factor Prices • A sudden increase in land, ceteris paribus, will make land relatively cheaper than labor. • More land will make labor more productive and hence raise wages. • Higher w/r ratio will raise the prices of cloth relative to food. • Income distribution will change in favor of labor.
Two Countries C C Foreign Home F F Given the same prices, which country produces RELATIVELY more cloth and which one relatively more food? As a result, which country’s relative supply curve (F/C) would be further to the right? Price is (PF/PC).
Supply, Demand, Prices If tastes and incomes were the same in both countries, price of food would be relatively higher in Home and relatively lower in Foreign. Home would export cloth and Foreign would export food. Free trade would move Pf/Pc between the two price levels. Home is relatively abundant in labor and Foreign is relatively abundant in land. Pf/Pc Home Foreign F/C
Price Lines in Both Countries C C Foreign Home F F The country at left has a lower Pf/Pc than the country at right. The slope of the tangent line is equal to Pf/Pc.
Price Lines with Trade C C Foreign Home F F The world price changes the production in both countries. The trade triangle should match both countries if these are the only countries trading.
Price Changes • Free trade will raise the price of the product produced by the abundant factor and will lower the price of the product produced by the scarce factor. • The country abundant in land sees an increase in the price of food and a drop in the price of cloth. • The country abundant in labor sees an increase in the price of cloth and a drop in the price of food.
Income Distribution • Owners of land in the land-abundant country will benefit. • Labor in the land-abundant country will lose. • Owners of land in the cloth specialized country will lose. • Labor in the cloth specialized country will benefit.
Factor Price Equalization • There is a one-to-one correspondence between w/r and Pc/Pf. As Pc/Pf becomes the same for both countries, so should w/r. • The country that exports the product with the abundant factor sees a higher return for that factor. Before trade, abundant factor got the lower return. • Scarce factor got the higher return before trade and the lower return after trade.
Factor Price Equalization • Trade makes two separate markets become one. • The country with the relatively abundant labor exports labor-intensive products. It is similar to exporting labor itself. • The country with the relatively abundant land, exports land-intensive goods. • The unified market makes the prices of labor and capital in both countries to converge.
Testing Factor Price Equalization • Contrary to the prediction of the model, factor prices vary across the countries. • Should we scrap the model? What characteristics of the model lead to equalization? • Both countries produce both goods. • Technologies in both countries are the same. • Prices of products become the same in both countries.
Divergent Resource Endowments • Convergence happens when resource endowments are similar and the relative differences force each country to move more toward the specializing in abundant factor using product. • If endowments are very divergent, each country would already specialize in a different product and trade would not equalize the factor prices. • Factor prices need not be equalized between countries with radically different ratios of capital to labor or of skilled to unskilled labor.
Different Technologies of Production • A country with a far superior technology in both products will have higher prices of both factors compared with the country with low technology. • Factor price convergence will not take place if technologies are very different.
Convergence of Prices • If prices in both countries do not become the same, factor prices will not, either. • Non-traded goods, transportation costs, tariffs, quotas all keep prices from converging.
Short vs. Long Run • The model says wages and land rents will be the same no matter which industry employs them. This is the long-run expectation. • In the short run, both factors in the expanding industry may benefit and those in the shrinking industry suffer (Pc/Pf changes). • Politics is a short run phenomenon.
Factor Price Equalization? • Real wages for unskilled labor (10th percentile of workers) rose only 0.2% between 1979 and 2001. • Real wages for highly skilled labor (95th percentile of workers) rose 29%. • College premium was 21% in 1979; 44% in 2002. • If US exports highly skilled labor products and imports unskilled labor products, then H-O theory prediction seems to hold.
Factor Price Equalization Does Not Apply to US Experience • H-O theory predicts that prices of goods will change before prices of factors. • Goods that are exported will experience a rise in price. • Studies fail to show any increase in the prices of skill-intensive products.
Factor Price Equalization Does Not Apply to US Experience • H-O says the price of the abundant factor will increase and the price of the scarce factor will decrease. • There is no indication that the return to skilled labor in NIEs has been falling; in fact, it has been increasing.
Factor Price Equalization Does Not Apply to US Experience • US trade with LDCs is very small percentage of GDP. In 1990, manufactured imports of US from LDCs was under 2% of GDP. • Labor content of both the exports and imports constitute a very small percent of total labor; it is not possible to have such a large impact on the wages.
What Is Responsiblefor the GAP? • Technological change.
Trade and Benefits • Does trade increase the total consumption of the people in a country? • How do you show this in a PPF and price line? • Ideally, every one can be better off.
Trade and Benefits • Different groups, different industries benefit and lose from trade. • But wages and rents will be the same across the industries in the long run, helping exporters and hurting importers. • Is there enough surplus to make both the exporters and importers better off?
Trade and Income Distribution • There is a political bias in trade politics: potential losers from trade are better politically organized than the winners from trade. • Losses are usually concentrated among a few, but gains are usually dispersed among many. • Each of you pays about $8/year to restrict imports of sugar, and the total cost of this policy is about $2 billion/year. • The benefits of this program total about $1 billion, but this amount goes to relatively few sugar producers.
Unemployment? • How much unemployment can be traced back to trade? • From 1996 to 2008, only about 2.5% of involuntary displacements stemmed from import competition or plants moved overseas. • Unemployment is primarily a macroeconomic problem that rises during recessions. • The best way to reduce unemployment is by adopting macroeconomic policies to help the economy recover, not by adopting trade protection.
Leontief Paradox • Wassily Leontief (Nobel 1973) tried to test Hecksher-Ohlin theorem. • H-O says countries export products embodying the abundant factor. • Leontief pioneered in creating input-output tables; he had the data on inputs used for outputs.
K and L Required to Produce $1 million of US Exports and Import Replacements