Download

1 / 77
770 likes | 852 Views
Discover key trends in pediatric medicine, practice Value-Based Care, and navigate the evolving healthcare landscape. Learn to bridge expectations with reality in patient care and tackle rising costs. Explore the new value paradigm in healthcare.

E N D
Bringing Value to the Table Without Ending Up on the Menu R. Allen Coffman, M.D., F.A.A.P. President TN Chapter of the AAP Highland Pediatrics, Hixson, TN Assistant Clinical Professor, UTCOM/TCTCH Chattanooga, TN
Disclosure Statement of Financial Interest I, Allen Coffman, DO NOT have a financial interest/arrangement or affiliation with one or more organizations that could be perceived as a real or apparent conflict of interest in the context of the subject of this presentation.
Disclosure Statement of Unapproved/Investigative Use I, Allen Coffman, DO NOT anticipate discussing the unapproved/investigative use of a commercial product/device during this activity or presentation.
GOALS • Identify several megatrends in pediatric medicine • Discuss the Value-Based Medicine approach to practice, it's purpose and benefits • Discuss the instability of a national medical system heavily financed by Employer-based payment • Describe gaps in reality of pediatric practice and the expectations of government, payors and patients • Encourage you in your practice of medicine
Source: Organisation for Economic Co-operation and Development (2010), "OECD Health Data", OECD Health Statistics (database). doi: 10.1787/data-00350-en (Accessed on 14 February 2011). Notes: Data from Australia and Japan are 2007 data. Figures for Belgium, Canada, Netherlands, Norway and Switzerland, are OECD estimates. Numbers are PPP adjusted.
National Health Expenditures per Capita, 1960-2010 NHE as a Share of GDP 5.2% 7.2% 9.2% 12.5% 13.8% 14.5% 15.4% 15.9% 16.0% 16.1% 16.2% 16.4% 16.8% 17.9% 17.9% Notes: According to CMS, population is the U.S. Bureau of the Census resident-based population, less armed forces overseas. Source: Centers for Medicare and Medicaid Services, Office of the Actuary, National Health Statistics Group, at http://www.cms.hhs.gov/NationalHealthExpendData/ (see Historical; NHE summary including share of GDP, CY 1960-2010; file nhegdp10.zip).
Source: Organisation for Economic Co-operation and Development (2010), "OECD Health Data", OECD Health Statistics (database). doi: 10.1787/data-00350-en (Accessed on 14 February 2011) Notes: Data from Australia and Japan are 2007 data. Figures for Belgium, Canada, Netherlands, Norway and Switzerland, are OECD estimates.
Source: Organisation for Economic Co-operation and Development (2010), "OECD Health Data", OECD Health Statistics (database). doi: 10.1787/data-00350-en (Accessed on 14 February 2011). Notes: Data from Australia and Japan are 2007 data. Figures for Canada, Norway and Switzerland, are OECD estimates. Numbers are PPP adjusted.
Distribution of National Health Expenditures, by Type of Service (in Billions), 2010 Nursing Care Facilities & Continuing Care Retirement Communities, $143.1 (5.5%) NHE Total Expenditures: $2,593.6 billion Note: Other Personal Health Care includes, for example, dental and other professional health services, durable medical equipment, etc. Other Health Spending includes, for example, administration and net cost of private health insurance, public health activity, research, and structures and equipment, etc. Source: Kaiser Family Foundation calculations using NHE data from Centers for Medicare and Medicaid Services, Office of the Actuary, National Health Statistics Group, at http://www.cms.hhs.gov/NationalHealthExpendData/ (see Historical; National Health Expenditures by type of service and source of funds, CY 1960-2010; file nhe2010.zip).
Cumulative Increases in Health Insurance Premiums, Workers’ Contributions to Premiums, Inflation, and Workers’ Earnings, 2000-2010 Notes: Health insurance premiums and worker contributions are for family premiums based on a family of four. Source: Kaiser/HRET Survey of Employer-Sponsored Health Benefits, 1999-2011. Bureau of Labor Statistics, Consumer Price Index, U.S. City Average of Annual Inflation (April to April), 1999-2011. Bureau of Labor Statistics, Seasonally Adjusted Data from the Current Employment Statistics Survey, 1999-2011 (April to April).
Average Annual Worker and Employer Contributions to Premiums and Total Premiums for Family Coverage, 1999-2011 $15,073* $13,770* $13,375* $12,680* $12,106* $11,480* $10,880* $9,950* $9,068* $8,003* $7,061* $6,438* $5,791 * Estimate is statistically different from estimate for the previous year shown (p<.05). Source: Kaiser/HRET Survey of Employer-Sponsored Health Benefits, 1999-2011.
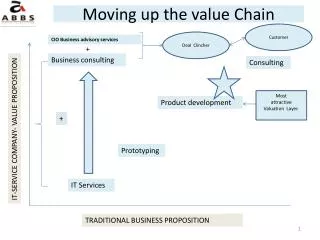
Pediatric Megatrends • Value Driven Care/Variable Value Definition • Leadership/Patient Expectation Gap • Employer-Based Care • Prevention/Personal Liberty • Shift in Disease Chronicity • New Technology/EHR/HIT • Increasing Cost/Complexity of Business
Best Practice The New Value of Medicine M T
Best Practice Community Standard of Care The New Value of Medicine M T
Best Practice What Families Value Community Standard of Care The New Value of Medicine M T
Best Practice What Families Value What Payors Value Community Standard of Care The New Value of Medicine M T
Best Practice Paid Services What Families Value What Payors Value Community Standard of Care The New Value of Medicine M T
M T Value-Based Medicine “Although most individuals would be quick to say that their health care is critical to them, they have better information available to them about airlines, restaurants, cars and sellers on eBay than they do about their healthcare.” Porter, M. E. and Teisburg, E. O. Redefining Health Care. Boston: Harvard Business School Publishing. p 54
M T Value-Based Medicine • Practice of medicine based on the value conferred by a systematic intervention. • Value is the ability to measure improvement in both length of life and quality of life. • Standardizes parameters used in valuing our interventions, and aims to do it well enough to put it into policy, or at least help physicians know the best way to proceed. • Projected $123.9 billion savings in 2004 ($1.7 trillion)
M T Value-Based Medicine Evidence-based medicine • practice of medicine incorporating the highest level of scientific evidence available • inception of the term in 1992 • Combats the innate biases of clinical practice deduction
M T Value-Based Medicine Patient-perceived value • conferred by healthcare interventions for the resources (dollars) expended • Dependant on quality of life instruments • Functional – AHA Functional Capacity Classification, Modified Rankin Scale • Preference – Standard Gamble, Willingness to Pay, Time Tradeoff
M T Value-Based Medicine Value-based medicine • Converts best evidence-based data to value based form using the preferences of patients who have lived with the disease or health state under study. • Patient-perceived value of virtually any intervention in healthcare can then be compared to that of any other intervention using the quality-adjusted life-year (QALY) as a common outcome measure. • Cost-utility can be calculated from the dollars expended for the value ($/QALY) gained
A Value Based Medicine approach to health care delivery is important because it…
A Value Based Medicine approach to health care delivery is important because it standardizes the parameters used to value medical intervention so that medical providers and patients can make better decisions
M T Value-Based Medicine Melissa Brown, M.D. Director of the Center for Value-Based Medicine, and is on the faculty at University of Pennsylvania and the Leonard Davis Institute of Healthcare Economics
M T Patient-Centered Outcomes Research Institute • The Institute will spearhead efforts to prioritize and fund Comparative Effectiveness Research (CER) • Establish an objective research agenda; • Develop research methodological standards; • Contract with eligible entities to conduct the research; • Ensure transparency by requesting public input; and • Disseminate the results to patients and healthcare providers.
M T Value-Based Medicine • Patient Care Management • Medical Home • Patient/Family Centered Care • Critically Assessed Topics • Evidence-Based Clinical Pathways • Health-Care Quality
M T Value-Based Medicine Metrics
NCQA ACO Metrics M T Quality Metrics to Measure Better Care for Individuals • 1)Patient/Caregiver Experience (7 measures) • 2)Care Coordination (16 measures, including transitions of care and HIT) • 3)Patient Safety (2 measures)
NCQA ACO Metrics M T Quality Metrics to Measure Better Health for Populations • 4)Preventive Health (9 measures) • 5)At-Risk Population/Frail Elderly Health (31 measures) on the following: Diabetes, Heart Failure, CoronaryArtery Disease, Hypertension, Chronic Obstructive Pulmonary Disease, Frail Elderly
Institute for Health Care Delivery Research Intermountain Healthcare http://intermountainhealthcare.org/qualityandresearch/institute/Pages/home.aspx
Intermountain Healthcare • 1995 Community Acquired Pneumonia Project (Sanpete County, Utah) • Initial triage criteria for hospitalization, the choice of initial antibiotics, the work flow to get antibiotics started quickly and a conversion protocol to shift inpatients to medications that could be delivered in the out-patient setting • Cost dropped 12.3 • Revenues dropped 17.5 percent because complications fell
M T Leadership/Patient Expectation Gap
Ambulatory Health Clinic Impact on National Economy M T 2008 2009 2010 • Health care and social assistance .................. 1,006.3 1,053.7 1,109.2 • Ambulatory health care services ........................ 487.2 (3.4) 506.4 (3.6) 549.3 (3.8) • Hospitals and nursing and residential care facilities 431.6 457.0 465.6 • Social assistance.......................................... 87.5 90.3 94.3 Donald D. Kim, Teresa L. Gilmore, and William A. Jollif. “Annual Industry Accounts Advance Statistics on GDP by Industry for 2011.” U.S. Bureau of Economic Analysis. May 2012. Web. 3 May 2012.
M T Leadership/Patient Expectation Gap • Each state to build IT platform • Each state negotiate with major insurers • CMS would build façade and integrate SSI and IRS data • State would run application for Medicaid and Medicare programs through the exchange • Subsides would than run through states exchange and financially support exchanges Insurance Exchanges
15 15 16 3 2 Statehealthfacts.org
M T Leadership/Patient Expectation Gap • Network of health care providers that band together to provide the full continuum of health care services for patients • Receives a payment for all care provided to a patient, and would be held accountable for the quality and cost of care • Proposed pilot programs in Medicare and Medicaid would provide financial incentives for these organizations to improve quality and reduce costs by allowing them to share in any savings achieved as a result of these efforts Accountable Care Organization
Why ACOs? M T • “The ACO is designed to provide greater efficiency in the provision of care. Its intent is to create an organization that takes out the seams between the physicians and the institutions and outpatient care -- so it’s really something that conceptually makes a great deal of sense.” Barry Ostrowsky, CEO of Barnabas Health, parent of Newark Beth Israel.
Why ACOs? M T Overarching Goals of the Shared Savings Program • Better care for individuals • Improve individual patient experiences of care along the IOM 6 domains of quality: safety, Effectiveness, patient-centeredness, timeliness, efficiency, and equity • Better health for populations • Encourage better health for entire populations by addressing underlying causes of poor health, such as physical inactivity, behavioral risk factors, lack of preventive care and poor nutrition • Lower growth in expenditures • Lower the total cost of care resulting in reduced expenditures
M T Leadership/Patient Expectation Gap • Network of physicians in a region or community—solo practitioners and groups of physicians—who agree to participate in an association to contract with health maintenance organizations, other managed care plans, and also vendors for the benefit of the each of the physicians in the IPA • Two distinct options an IPA may take with regard to its managed care operations: assume financial risk for its physician members; or, allow the third-party payors with which the IPA contracts to continue to act as the insurer, and, therefore ultimately the insurer remains financially accountable for the deals they strike with the IPA. Independent Practice Association