Download
1 / 62
620 likes | 702 Views
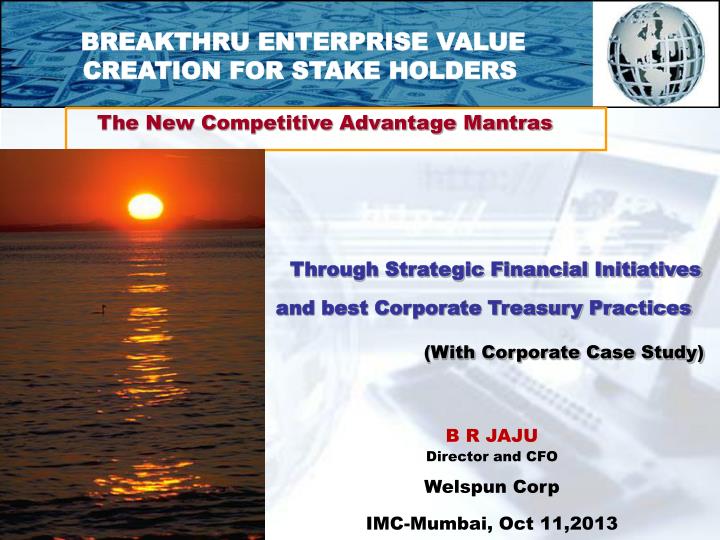
BREAKTHRU ENTERPRISE VALUE CREATION FOR STAKE HOLDERS. The New Competitive Advantage Mantras. Through Strategic Financial Initiatives and best Corporate Treasury Practices (With Corporate Case Study) B R JAJU Director and CFO Welspun Corp IMC-Mumbai, Oct 11,2013. Steroids.

E N D
BREAKTHRU ENTERPRISE VALUE CREATION FOR STAKE HOLDERS The New Competitive Advantage Mantras Through Strategic Financial Initiatives and best Corporate Treasury Practices (With Corporate Case Study) B R JAJU Director and CFO Welspun Corp IMC-Mumbai, Oct 11,2013
Steroids Conventional Way of Managing Business /Finance + No Ethical practices & Growth Strategy + IT iIlusion = Dying Corporates on Steroids 8/16/2014 3
Let us take deep dive • Changing business landscaping : India perspective with global paradigms & New age CFO challanges • Value propositions : Enhance enterprise value and strategy map • Moving into new orbits :Preparing for renewed growth thru best financial practices • Business growth strategies: M&A and key concerns • Corporate Case Study : trigger for learnings • Parting thoughts and key take aways
Changing business landscaping (India perspective with global paradigms)
2005 - After - Achieve viability of operations in global environment - Change in mindset to become a global company Prior to 1990s 1990-2005 IT enabled Processes & Technology Advancement - India is the only market - The manufacturer could sell whatever it could produce - Exposed to International Markets(Products &Capital) and Competition Changing Business Models (Consolidation & Outsourcing) M&A Customer Expectation Business Dynamics Initiatives Initiatives Regulatory Compliances Global Competition Governance & Best Practices Business Risks & Security Concerns Global Dynamics –India’s perspective
How Global Corporates have destroyed values –Key learnings Emerging Technologies Changing Customer Tastes Conflicting Interests/Frauds Self Denial Exceptional Achieve of Past wraps present realities Nobody can duplicate your products You are smarter than others Arrogance (Pride before fall) Past Success under regulated monopoly U were chosen for success by govt U are run with Govt. control Complacency Justify every financial norms for growth and unearned profits Achieve growth devoid of business fundamentals Overleveraging and over trading on equity Greed Obsession
Let us look at Corporate value destroyers Corporate ScandalJobs Lost Shareholders wealth lost $ bln) • Enron Created off B/S exposures to hide debts & losses 4500 80 • Xerox Impropriety reports $ 6.5 bln. In revenue (over 5 years) 13600 3 • Worldcom Hidden expenses ($ 3.9 bln) to raise bottom line 17000 100 • Merck Over $ 14 bln revenue reported for many years, never collected NA 43 • Quest.com Inflated revenue thru equip. sales / Swaps 11000 33 And list goes on………….
New Age Finance Leadership Core concerns and Challenges • Competencies & Challenges • Understanding of how money (or value is made) or lost in business (value chain competencies) • Appreciation of the concept of risk (risk competencies) • Perspective on expectations of different stakeholders (stakeholders expectations competencies) • Regulatory compliances • Performance measurement • AS STRATEGIC GUARDIAN OF THE ECONOMIC VALUES OF AN ENTERPRISE
NEW AGE CFO_KEY DIFFERENTIATORS • Be a key enabler in • Drive growth • Profitability – Product – Consumer • Cost Control • Customer analysis • Internal controls • Function/ Business partnership • Asset management – F/A, Working capital (focus on inventory, receivables), Cash • Corporate Governance. • Risk Management • Efficient transaction processing/ reporting Co. Financial to stakeholders • People development • Uphold Company Values & create an environment of trust & reliance Moving into New Orbits
Value propositions Enhance enterprise value and strategy map
Radical Performance Improvement is possible… High performance companies exist even in the so-called ‘unattractive’ industries. It requires mindset and willingness to benchmark, not against the average or the comparable, but against the best and draw both inspiration and learning form those benchmarks to drive oneself forward. L. N. Mittal
Revolutionary Balance Sheet To Capture True Enterprise Value Assets Liabilities • Off Balance Sheet Liabilities • LD/TP Claims • Tax /Legal Disputes • BG/CG Impact • Indirect borrowings • Commitment Failures • Volatility -Forex /Commodity/Int.t • Op. cash gen./FCF • Performing Assets • Sales Growth – • New Product/Market/ Customers • Order Book-Visibility/ • Profitability TANGIBLE • Credit Rating • CustomerS & Vendors-In pipeline • Empowered HR resources • Business Intelligence • Brand Building -IPR • New Products in Pipeline • cutting Edge Technology INTANGIBLE • Financial Reputaion • Bad Publicity • Employee Disengagement • Customer mistrust. • Integration Failure -post M &A Enterprise Value = NW +Debt Payable + Additional Value of Above Net Assets
Enterprise Value –Assets driving success • Tangible Assets • Land and Buildings • Plants and Equipment • Investments and Cash • Intangible Assets • Human Capital • Relationships • Brands • Culture and Right Practices • Debtors • Inventories • Knowledge, IT Infrastructure and Capabilities Tangible assets are easily measured, monitored and controlled and hence are always in focus… However, it is the Intangible assets that drive the large success of a company and its enterprise value A company’s Assets
BUILDING BLOCKS TOWARDS GENERATING FCF Higher supplier credit Fall in Inventory/ Debtors levels Higher labour productivity Statutory Tax payments Sales Volume growth Acquisition funding Loans repayments Working capital reduction Free Cash Sourcing efficiency Higher Cash Flows from Opns Net Profit growth R&D / Technology efficiency Lower Capex Lower Interest cost Economies of scale Efficient tax planning Higher capital productivity Assets getting “sweated more”
Business Transformation- Major Enablers & Pillars. (to enhance enterprise value) Business Drivers Ethical practices & Governance Reduce Cost of Capital Divest / Hive off (NPB/NPA) Operating Excellence Long term value creation Cost Competitiveness Reliable Operation Organization Capability Throughput Improvement Revenue Growth Engaged Employees Technology Up-gradation Customer Focus Manpower Productivity Working Capital Management Innovations
A Strategy Map towards Transformational Value Creation Long-Term Shareholder Value Financial Perspective Improve Cost Structure Increase Asset Utilization Expand Revenue Opportunities Enhance Customer Value Customer Value Proposition Customer Perspective Price Quality Availability Selection Functionality Service Partnership Brand Product / Service Attributes Relationships Image Internal Perspective Operations Management Processes Customer Management Processes Innovation Processes Regulatory and Social Processes • Supply • Production • Distribution • Risk Management • Selection • Acquisition • Retention • Growth • Opportunity Identification • R&D Portfolio • Design / Develop • Launch • Environment • Safety and Health • Employment • Community Human Capital Learning and Growth Perspective Information Capital Organizational Capital Culture Leadership Alignment Teamwork Productivity Strategy Growth Strategy
ENHANCING STAKEHOLDERS VALUE - VALUE CHAIN : SOCIO ECONOMIC ENVIRONMENT Critical Resources (X)
Moving into new orbits-Financial Innovations Preparing for renewed growth thru best financial practices
S T R A T E G I C I M P E R A T I V E S • Grow the volumes aggressively • Manage the net realisations judiciously • Control the costs / Eliminate the wastages ruthlessly • Sweat the assets relentlessly
Cash is King-Increasing Cash Conversion Under Utilized Assets Intelligent Capital Allocation Working Capital Management • Surplus property - Disposal of surplus / empty properties • Tail brands - Disposal of non-core / declining brands - Reduces management distraction. • Invest right amount of Capex in the right places • Capital to be allocated to attractive and strategic projects. • Capital will become more difficult to get… but not under invest in the business. • Monitor Payback and assets turn. • Trade working Capital • Days Net Working • Capital • Align with Peers
Making Balance Sheet strong and leverageble • Fixed assets, own or outsource → to create value and improve asset turn • Goodwill, → to enhance growth thru brand value and improve ROIC • Working Capital, → drive down the working capital to build operating efficiency • Investments → ensure safety of investments and optimize returns post tax and action plan to minimize risks. • Cash, → reduce the idle cash in the business to improve operating efficiency Physical verification of assets, valuation of inventories, confirmation of balances, valuation of investment for market value thru expert valuers is critical. Mandate going concern, Prudence and Consistency principles to protect the shareholders interest and value of business. • Loans → take care of liability by repaying in time principal & interest • Reserve and Surplus → leverage the strength of capital to raise funds to build and grow the business • Share Capital → critical to drive ownership, voting rights, decision making and control of business
FINANCIAL SUPPLY CHAIN – AN INTEGRATED PROCESS OF EFFECTIVE FINANCIAL MANAGEMENT Cash & liquidity management Dispute management Collection management Credit management Finance working capital Check credit worthiness Settle & pay Issue invoice Forecast cash Resolve disputes Collect cash reconcile Electronic bill presentation & payment In-house cash management Treasury & risk management Tripartite transfer of funds between bankers, customers & suppliers Financial Supply Chain Management is an integrated approach to Provide better visibility and control over all cash-related processes, better predictability of cash flow, reduction of working capital, reduction of operating expenses and end-to-end integration of business processes
Best Practices – driving forces & key differentiators For Driving Efficiencies – Enablers & Differentiators
Assess potential business risks /alarms • Demand shortfall • Competition • M&A integration • Misaligned products • Customer pricing pressure • Loss of key customer • Regulatory problems • R&D delays • Supplier problems • Cost over-runs • Accounting irregularities • Management ineffectiveness • Supply Chain • Macro-economic issues • Commodity price shift • Interest rates • Lawsuits • Natural disasters/ physical risk • Chance losses Losses by category of risk Strategic: 58% Operational: 31% Financial: 6% Hazard: 5%
Reduction Risk Transfer TOTAL RISK Retained Risk Technical Improvements Risk Engineering Procedural Changes Strategic Planning Business Consulting Re-structuring Contract Terms (e.g. PVC) Insurance/ Hedges Risk Securitisation Managed from:- Earnings and Reserves Risk Mitigation Process and Tools Elimination
GUIDING MANTRAS OF CORPORATE FINANCE NON CONVENTIONAL TRENDS • Reliable, complete, timely MIS to support business decisions. • Benchmark financial performance against best among peer group/Industry. e.g. cost of funds, securitization, structure financing, treasury products & mix of financing • Focus on sustainability of business margins through efficient costing system, WC management, commodity/Forex hedges, ongoing MSR analysis and review of quality of order book (for potential LD & margins analysis) • Monitoring of free cash flow to avoid potential NPA & sticky assets. • Regulatory compliances & adherence to corporate policies & practices. • Accurate budgetary & forecast to predict WC requirements and secure growth financing well ahead of the needs. • Drive accountability & performance review supported by measurable metrics & indicators. • Target to run all major business processes with least human intervention & have them IT enabled to ensure data integrity & seamless processing of MIS.
Measure Corporate Health-Diagnostic Tools 8/16/2014 16
Ideal Diagnosic Metrics of Corporate Health • Balance Sheet Ratios : Red Signal : If Sales & revenue continue to climb while these ratios show a decline (Scenario happens in fast growing company), you see serious problem after some time e.g. symptoms of debt trap, signs of near insolvency, diversion of Short term funds for Long term Obligations. 8/16/2014 17 BR JAJU – Welspun Gujarat Stahl Rohren Ltd
Ideal Diagnosic Metrics of Corporate Health • Hybrid Ratios for Business performance :- B / S & P&L Red Signal : with increasing EBIDTA margins but decline in ROCE could signify idle capacity and no sweating of assets OR could be high generation of NPA / NEA or irregular Accounting of capitalisation (Enron’s Case).
Ideal Diagnosic Metrics of Corporate Health • Liquidity Ratios :- Red Signal : Depressed ratios could signal wrong or Stringent Accounting Treatments of non-cash charges. OR Bad Management of working Capital & un-prudent Capex. 8/16/2014 19 BR JAJU – Welspun Gujarat Stahl Rohren Ltd
Best Financial Practices-Internal Controls Control Techniques Preventative Detective Corrective Regular Internal audits External Audits Reconciliation of inventory counts with perpetual records Comparison of reported results with plans & budgets Segregation of duties - Authorization Matrix Business systems integrity and continuity controls Physical safeguard & access restriction control (human, financial, physical & information assets) Effective planning & budgeting process
Future VA growth expectations Fundamental Value of the business could be viewed as the sum of Current Operations Value (COV), and Future Growth Value (FGV)… VA Market Value Future Growth Value VA VA VA VA VA VA Current Operating Value Focus on both Renewal of FGV through investments for the future ……. & Conversion of opportunities into performance through operational excellence Current Operations Value (COV) represents the "no-growth" value of the company Future Growth Value (FGV) represents the investors expectation of performance improvements over and above the level of current operations
Illustration: Projections on future profitability and value of R&D investments and M&A helped management better understand the ‘Value Gap’ to be bridged for delivering the target shareholder returns… Initial ‘Value Gap’ Identifed ‘Value Gap’ $1.1bn M & A / Inorganic Growth $6.2bn $2.7bn Value Gap Talent Development (Global Leaders) $0.8bn $0.8bn Value of R&D pipeline / Technology $1.0bn Value of growth in PAT $1.0bn Value of growth in PAT $2.5bn $2.5bn $2.5bn Value of sustaining existing PAT Value of sustaining existing PAT 2008 2013 2013 This exercise helps management in: a) better understanding the ‘Value Gap’ & implications to shareholders b) identifying/ crystallizing avenues to bridge the gap
Business growth strategies M&A and key concerns (Focus on Cross Border Deals)
Most Common Cross Border Transactions • Export of Goods/ services - fuelled by BPO/Internet • Setting up branch offices, subsidiaries & manufacturing facilities • Acquisitions abroad • Raising funds thru’ foreign bourses/ ECB’s, etc
UNIQUE DRIVERS TO TRIGGER CROSSBORDER M&A DEALS • Consolidated & mature domestic markets • Do not offer sufficient opportunities to re-invest earnings • Overcome entry Barriers • - Ease entry into markets • Access to local advantages • - Regional diversification • - Tax advantages • - Access to local capital markets • Betting on future technologies • Increasing value chain width • Regulatory changes
KEY SUCCESS FACTORS & MAJOR ENABLERS Successful M & A leads to Value Creation for Stake Holders • Acquisition involves making judicious choices between often • conflicting priorities • Strategic fit, friendly transaction, due diligence (Social, Economic and • Legal) & Complimentary Resources are key to Synergy • Each acquisition has a strategic rational that must be embedded into the • Integration Process • Two stage Integration - • Reap benefits of Low hanging fruits in short term • StrategicRoad map to achieve long term objectives • Without a clear understanding of objectives and expectations the • path of least resistance will be followed • The best partner for marriage can become the most difficult spouse
SYNERGIES/ OPTIONS- FOR SUCCESSFUL CROSS BORDER DELS - • Cost Synergies • R&D, procurement, manufacturing, selling & marketing, distribution & Administration • Revenue Synergies • - New cross selling • Pricing power & market share • Increasing each product peak level sales extending product’s life and adding new products • Evaluating Quality of synergy Estimates • Sources of synergies - higher margins, increased capital efficiency, high growth & lower cost of capital • Alternatives to Acquisition • - Joint ventures & Alliances • - Organic & Brownfield Expansions
INTEGRATION STRATEGY Best Integration Strategy Transformation Best of Both Absorption Standalone To achieve integration by “ Best of Both and Transformation Process” Objective - To create multinational centered around the principle of performance orientation Guiding Principles - Values - Synergies - Respect of Talent High Degree of Change in both Companies Culture and Practices Low Integration Challenge & Shareholder’s value Addition Low High
INTEGRATION CHALLAENGE KEY TO SUCCESS OF CROSS BORDER M&A DEALS Intellectual Integration Brands & Technology keeping pace with market demands Benchmarking Learning & Unlearning Operational improvements (Best of Both) Sourcing Engineering Quality Technology Fast Forward Social Integration Emotional Integration Us vs Them Local vs Glocal Guiding Principles Belonging to the Parent Group Communication DNA of Integration….
Valuation Challange Once identification has been completed, the process of valuing the target begins. A variety of valuation techniques are widely used in global business today, each with its relative merits • Assets Based Valuations • Business Multiples - EV/ EBITDA, EV/ Turnover, PE (EPS) • Quicker and simpler • Equity markets use it to judge the deals • DCF Analysis • Allows for rigorous analysis • Key sensitivities can be evaluated • Additional cash flow due to synergies arising in case of mergers “ A Business is worth what someone is prepared to pay for it !”
Deal structuring • Financing • Debt Equity ratio – bases on industry benchmarks, profitability, bankability • Bridge loan, Mezzanine/Subordinated Debt, Overseas– ECB, FCCBs etc • Share exchange, part cash and part share • Management Control • Shareholder Agreement – RoFR, Anti dilution, Drag along, Tag along rights, deadlock provisions, Board representation (in JVs, PE investment) • Indemnities for known risks, brand transfer etc. in the Agreement • Forming an SPV • Tax implications in different jurisdictions on dividend, interest income, capital gain, operating income, etc • Mauritius (incorporation status GBC I & GBC II differ in tax benefits) , DTAA • Singapore (DTAA & FTAs, tax incentives in shipping) • British Virgin Islands (negligible taxes)
Tata Corus Merger • Acquirer – TATA Steel • 56th largest & India’s 2nd largest steel company • Lowest cost steel producers • Target - Corus • 2nd largest steel producer in Europe. 10th largest in the world • Rationale • Combined entity - 5th largest producer of steel from 56th position of TATA • Would have taken several years for Tatas to build would an enterprise of a size of Corus • Acquisition to provide significant presence in Europe Deal • 100% stake in the Corus group in all cash deal, valued at USD 12.94 Bn. • One of the largest Indian takeover of a foreign company
Tata Corus Merger-Financing structure Equity of $ 4.1 Bn. • Methodology • • SPV’s were floated in UK under the name Tata Steel UK. Tulip SPV Holdings (1,2,3) which were ultimately held by a Singapore SPV • • Tata Steel alongwith the SPV’s incorporated in Singapore and UK raised the requisite debt of USD 8.8 bn constituting 68% of the total acquisition value of USD 12.94 bn. • Debt was proposed to be pushed in each subsequent subsidiary and ultimately the same was infused as equity in Corus. TATA Steel India 100% Singapore Co Debt 100% Equity of $4.1 bn, Quasi equity of $1.25 bn & Bridge loan of $ 1.41 b UK Co 1 Debt 100% UK Co 2 Debt 100% UK Co 3 Debt 100% TATA Steel UK Corus Acquired Corus out of $6.76 bn received from SPVs & long term debt of $6.14 bn from consortium of bank
Tata Corus Merger-Finacing rational • Tata Steel acquired Corus for $12.94 bn • Equity Contribution of $ 4.14 bn & • Borrowings of $8.80 bn through subsidiaries • Tax consolidation in UK, tax shield on interest available to Corus • Debt-equity ratio of funding is 68:32 as Tata Steel UK could not have raised so much of loan due to strict UK regulations – Thin Capitalisation norms for tax • Corus paid loan out of its own cash flows and eliminated the tax to be paid on the dividend received from Corus