Download
1 / 57
580 likes | 880 Views
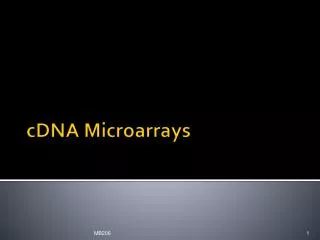
cDNA Microarrays and some of their applications to Clinical Medicine. Pascale F. Macgregor, Ph. D. LMP 1019S April 12, 2002. Outline of the lecture. What are microarrays? **Manufacturing **Different types of microarrays **Possible applications **Data analysis

E N D
cDNA Microarrays and some of their applications to Clinical Medicine Pascale F. Macgregor, Ph. D. LMP 1019S April 12, 2002
Outline of the lecture • What are microarrays? **Manufacturing **Different types of microarrays **Possible applications **Data analysis • Application of the microarray technology to the study of ovarian cancer • Combination with cytogenetics • Laser Capture Microdissection • Validation: tissue arrays, RT-PCR, ISH, IHC ©2002 University Health Network/Ontario Microarray Network
What are Microarrays? • Microarrays are simply small glass or silicon slides upon the surface of which are arrayed thousands of genes (usually between 500-20,000) • Via a conventional DNA hybridization process, the level of expression/activity of those genes is measured • Data are read using laser-activated fluorescence readers • The process is “ultra-high throughput” ©2002 University Health Network/Ontario Microarray Network
Glass slide microarray of thousands of genes for evaluation as new biomarkers for cancer prognostic assessment ©2002 University Health Network/Ontario Microarray Network
Why analyze so many genes? • <10% of the human genome has been studied at the level of gene function. 40,000 odd genes represent the pool of remaining drug targets. • Patterns/clusters of expression are more predictive than looking at one or two prognostic markers. • Increased accuracy/confidence. • Unbiased. Empiric. Holistic. Independent of “flawed” hypotheses ©2002 University Health Network/Ontario Microarray Network
Microarray technologies There are two primary microarray technologies which are somewhat complimentary: 1. On-chip oligonucleotide synthesis: e.g. Affymetrix® Gene Chips 2. Direct DNA deposition: “Pat Brown” approach (oligos or gene fragments - Expressed Sequence Tags, “ESTs”) ©2002 University Health Network/Ontario Microarray Network
Affymetrix Gene Chip TM • Produced by synthesizing tens of thousands of short oligonucleotides in situ onto glass wafers • 16-20 nucleotides representing each gene on the array • Each oligo on the chip is matched with an almost identical one, differing only by one single base mismatch • Comparison of target intensity between the 2 partners oligonucleotides • Measure of the absolute level of expression of genes ©2002 University Health Network/Ontario Microarray Network
Affymetrix Gene Chip TM Nature Genetics 21:2-24 1999 ©2002 University Health Network/Ontario Microarray Network
On-chip oligonucleotide synthesis Nature Genetics 21:5-9 1999 ©2002 University Health Network/Ontario Microarray Network
Spotted cDNA microarrays Advantages • Lower price and flexibility • Simultaneous comparison of two related biological samples (tumor versus normal, treated cells versus untreated cells) • ESTs allow discovery of new genes Disadvantages • Needs sequence verification • Measures the relative level of expression between 2 samples ©2002 University Health Network/Ontario Microarray Network
Spotted arrays chemically modified slides 384 well source plate steel spotting pin 1 nanolitre spots 90-120 um diameter ©2002 University Health Network/Ontario Microarray Network
The 6 steps of a microarray experiment (1-3) • 1- Manufacturing of the microarray: clone collection acquisition (+ sequencing), PCR amplification and insert verification, spotting, QC. • 2- Experimental design and choice of reference: what to compare to what? • 3- Target preparation (labeling) and hybridization ©2002 University Health Network/Ontario Microarray Network
The 6 steps of a microarray experiment (4-6) • 4- Image acquisition (scanning) and quantification (signal intensity to numbers) • 5- Database building, filtering and normalization • 6- Statistical analysis and data mining ©2002 University Health Network/Ontario Microarray Network
From Macgregor and Squire, Clinical Chemistry, 2002 ©2002 University Health Network/Ontario Microarray Network
Cy-3 Cy-5 ©2002 University Health Network/Ontario Microarray Network
Gene D Over-expressed in normal tissue Gene E Over- expressed in tumour • Biomarkers of prognosis • Genes affecting Treatment Response ©2002 University Health Network/Ontario Microarray Network
Microarray Applications (some) • Can identify new genes implicated in disease progression and treatment response (90% of our genes have yet to be ascribed a function) • Can assess side-effects or drug reaction profiles • Can extract prognostic information, e.g. classify tumours based on hundreds of parameters rather than 2 or 3. • Can detect gene copy number changes in cancer (array CGH) • Can identify new drug targets and accelerate drug discovery and testing • ??? ©2002 University Health Network/Ontario Microarray Network
The challenges of microarrays • Acquisition of high quality clinical samples, tumor and normal tissues • High Quality RNA • Experimental design: what to compare to what? • Data analysis -1: what to do with the data? • Data analysis -2: How do to it? • Very large number of data points • Size of data files • Choice of data analysis strategy/algorithm/software ©2002 University Health Network/Ontario Microarray Network
Experimental Design • Choice of reference: Common (non-biologically relevant) reference, or paired samples? • Number of replicates: how many are needed? (How many are affordable...?). Are the replicate results going to be averaged or treated independently? • Dye switches? • Choice of data base: where and how to store the data? ©2002 University Health Network/Ontario Microarray Network
What is a “dye switch”: • One slide with experimental sample labeled with Cy5, and reference sample labeled with Cy3 (“straight”). • Replicate slide with experimental sample labeled with Cy3, and reference sample labeled with Cy5 (“switch”) ©2002 University Health Network/Ontario Microarray Network
Data Pre-processing • Filtering: background subtraction? Low intensity spots? Saturated spots? Low quality spots (ghosts spots, dust spots etc). • Filtering or flagging? • Outliers? ©2002 University Health Network/Ontario Microarray Network
Data Pre-processing : Normalization • Housekeeping genes/ control genes • Intensity dependent (most commonly used): global intensity or global ratio, calculates a single normalization factor • Intensity independent (LOWESS – Locally Weighted Scatter plot Smoother) calculates a function • Global array or Sub-array http://stat-www.berkeley.edu/users/terry ©2002 University Health Network/Ontario Microarray Network
Microarray data analysis 101 • Scatter plots of intensities of tumor samples versus normal samples: quick look at the changers and overall quality of microarray • Supervised versus unsupervised analysis • Clustering: organization of genes that are similar to each other and samples that are similar to each other using clustering algorithms • Statistical analysis: how significant are the results? ©2002 University Health Network/Ontario Microarray Network
UP log/log scatter plot DOWN ©2002 University Health Network/Ontario Microarray Network
2 dimensional hierarchical (“Eisen”) clustering(Eisen et al, PNAS (1998), 95, p. 14863) • Unsupervised: no assumption on samples • The algorithm successively joins gene expression profiles to form a dendrogram based on their pair-wise similarities. • Two-dimensional hierarchical clustering first reorders genes and then reorders tumors based on similarities of gene expression between samples. ©2002 University Health Network/Ontario Microarray Network
Two dimensional hierarchical (“Eisen”) Clustering From: Dhanasekaran et al. Nature, 421, p.822. ©2002 University Health Network/Ontario Microarray Network
Significance Analysis of Microarrays(SAM) • Supervised learning software for genomic expression data mining • Developed at Stanford University, based on the paper of Tusher et al PNAS (2001) 98, p. 5116. ©2002 University Health Network/Ontario Microarray Network
What SAM does: • SAM assigns a score to each genes on the basis of the change in gene expression relative to the standard deviation of repeated measurements. • For genes with scores above a certain threshold (set by the user), SAM uses permutations of the repeated measurements to estimate the % of genes identified by chance = the false discovery rate (FDR). ©2002 University Health Network/Ontario Microarray Network
SAM example: ovarian tumor versus normal ovary UP DOWN ©2002 University Health Network/Ontario Microarray Network
Every cell in the body has the same genetic constitution. In cancer cells there is usually acquired aberrant DNA Development of “cancer genomics” to better understand the molecular basis of acquired genetic change Breast Ovary Prostate ©2002 University Health Network/Ontario Microarray Network
TEAM WORK in ovarian cancer at the UHN • Clinicians / Pathologists / Basic Scientists / Computer Scientists • Tissue bank (tumor tissue and normal ovary tissue) of ~ 500 samples • New patients treated at Princess Margaret’s Hospital for ovarian cancer (~100/ year) • Microarray Centre / Basic Research labs ©2002 University Health Network/Ontario Microarray Network
Epithelial Ovarian Cancer • First cause of death by gynecological cancer • 5th cause of death by cancer for women • Early Diagnostic (20%): 5 year survival rate is 80% • Late diagnostic (80%): 5 year survival rate is 10-15% • Treatment: Carboplatin + Taxol • Recurrence after treatment in 80% of cases ©2002 University Health Network/Ontario Microarray Network
Urgent need for: • Improved detection • Better tumor classification • Better evaluation of response to currently used and experimental chemotherapy • New therapeutic targets • New treatments ©2002 University Health Network/Ontario Microarray Network
My lab’s approach: • Combine the powers of chromosome/DNA analysis (cytogenetics/genomic) and RNA expression (cDNA microarrays) to facilitate the identification of smaller subsets of genes pertinent to epithelial ovarian cancer. ©2002 University Health Network/Ontario Microarray Network
Microarray study design • All microarrays experiments were done on 19.2 K arrays, in duplicate, with “dye switches”. • 15 serous epithelial ovarian tumors, 7 normal ovaries • Stratagene Universal Reference RNA was used as an internal standard in all experiments. • 52 successful microarrays were hybridized and analyzed, for a total of 2 million data points. ©2002 University Health Network/Ontario Microarray Network
Normal ovary #1 versus normal ovary #2 Tumor ovary versus normal ovary #1 From Bayani et al, Cancer Research 2002 ©2002 University Health Network/Ontario Microarray Network
Combining supervised with unsupervised strategies From Macgregor and Squire, Clinical Chemistry, 2002 ©2002 University Health Network/Ontario Microarray Network
Conclusions of microarray analysis of ovarian samples (1) • Normal ovary samples clustered separately from tumor samples and early EOC clustered as a group. • Separation between early EOC and late EOC less evident, but a group of late EOCs clustered together. ©2002 University Health Network/Ontario Microarray Network
Conclusions (2) • Several new up-regulated genes identified in regions of chromosomal gains • Cis-platinum resistance related protein: Is differential gene expression between patients a predictor of treatment response? ©2002 University Health Network/Ontario Microarray Network
Going further… • Narrowing down the number of candidate genes by combining approaches: RNA and DNA / chromosome analysis • Are the genes that are over-expressed in regions of gene copy number gains? ©2002 University Health Network/Ontario Microarray Network
Chromosome CGH ©2002 University Health Network/Ontario Microarray Network
SKY Method • Uses chromosome ‘paints’ labelled with combinations of fluorochromes so that unique spectral signal will identify chromosome region involved in aberration ©2002 University Health Network/Ontario Microarray Network
CGH and SKY Analysis of Ovarian Patient 13A (OCA13A) From Bayani et al, Cancer Research 2002 ©2002 University Health Network/Ontario Microarray Network
Tumor heterogeneity challenge **Some cancers, such as prostate cancer, are multifocal / heterogeneous. **For these tumors, “bulk” extraction of genetic material from tumor tissue will produce microarray results that are “contaminated” by normal or pre-malignant tissue. ©2002 University Health Network/Ontario Microarray Network
Laser Capture Microdissection (LCM) ©2002 University Health Network/Ontario Microarray Network