Download
1 / 10
110 likes | 353 Views
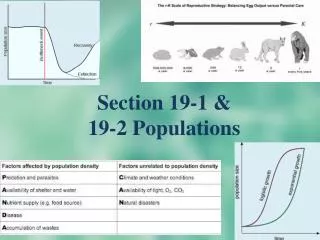
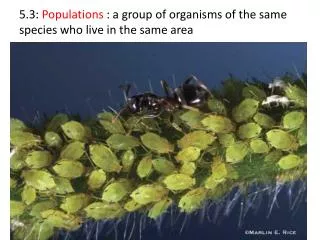
5.3: Populations : a group of organisms of the same species who live in the same area. 5.3.1: Factors affect pop size. birth rate immigration rates death rates emigration rates. 5.3.2: Sigmoid Growth Curve. Plateau phase. Transitional phase. Exponential phase. exponential phase

E N D
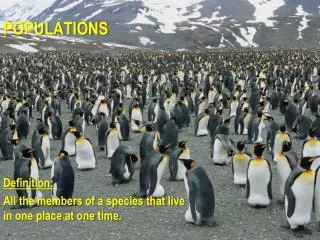
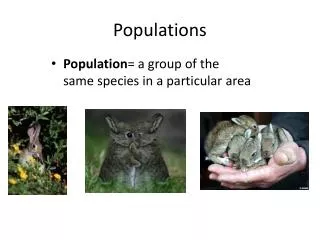
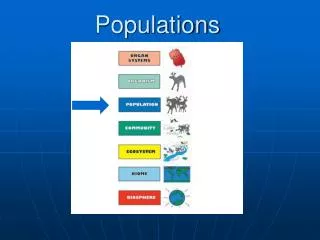
5.3: Populations : a group of organisms of the same species who live in the same area
5.3.1: Factors affect pop size birth rate immigration rates death rates emigration rates
5.3.2: Sigmoid Growth Curve Plateau phase Transitional phase Exponential phase
exponential phase • population doubles per unit time producing exponential/geometric growth • no limiting factors: nutrients, oxygen, space in ample supply • transitional phase • population growth continues, but at an ever-decreasing rate • limiting factors slow growth rate: nutrients, oxygen, space in ever-shorter supply • plateau phase • population growth slows to zero: population becomes stable • limiting factors inhibit growth: nutrients, oxygen, space in short supply
Population growth is fastest during the exponential growth phase because (birth rate + immigration) exceeds (death rates + emigration). Population growth slows down during the transitional phase because disease, predation and competition set limits to population increase. Disease spreads faster as populations get larger and therefore reduces the number of individuals who can reproduce. Predators can hunt more successfully as the prey population increases, which in turn increases the population of predators (negative feedback). Resources become scarce when a population is large, which in turn increases competition. Population growth is zero at the plateau phase because it has reached its carrying capacity, which is the maximum population size that an environment can support. At carrying capacity, populations tend to produce more offspring than can be supported by the environment. This leads to extreme competition for resources such as food, shelter, nesting space and so on.
Draw a labelled graph showing a sigmoid (S-shaped) population growth curve. [4] N10/4/BIOLO/HP2/ENG/TZ0/XX N10/4/BIOLO/SP2/ENG/TZ0/XX/M 5. (a) x-axis labelled as time/t and y-axis labelled as number/N/population size; ⎧⎪⎨⎪ ⎩ Both labels needed. Do not accept “population” by itself. curve clearly showing the shape of the three phases; ⎧⎪⎨⎪ ⎩ oscillations of plateau phase not required exponential/rapid growth phase labelled/highlighted properly; (accept log phase) transitional/slowing phase labelled/highlighted properly; plateau/no growth phase labelled/highlighted properly; (accept stationary phase) carrying capacity/K drawn and labelled as a parallel line to x-axis at plateau level; [4 max]
M08/4/BIOLO/SP2/ENG/TZ1/XX+ Draw and label a graph showing a typical population growth curve. Award [1] for each of the following clearly drawn and correctly labeled. sigmoid/s-shaped graph; time labelled on x-axis; population (size/number) labelled on y-axis; exponential growth phase; plateau phase / accept accurate annotations; transitional phase / accept accurate annotations; [5 max]
Draw a diagram and explain the shape of population growth curves. [8] N08/4/BIOLO/SP2/ENG/TZ0/XX+ (b) diagram: curve is sigmoid (s-shaped) and labelled with population/size/number on y-axis and time on x-axis; three regions/phases labelled exponential (could include curvature at start), transitional, plateau; explanation: exponential region/phase: [2 max] exponential region is where population is growing very rapidly; natality rate exceeds mortality / immigration rate exceeds emigration; food/space/resources abundant/diseases/predators at minimum/no limiting factors; transitional region/phase: [2 max] population growing at a slower rate; natality falling/mortality rising / immigration falling/emigration rising; natality rate still higher than mortality; limitations caused by reduced food/space/resources / more disease/more predation begin to take effect; plateau region/phase: [2 max] population size is (more or less) constant / rate of increase is zero; combination of natality and immigration rates balanced by combination of mortality and emigration rates; food/space/resources/diseases/predators are significant limiting factors; [8 max]
5.3.4: Factors setting limits to pop size Disease spreads faster as populations get larger and therefore reduces the number of individuals who can reproduce. Predators can hunt more successfully as the prey population increases, which in turn decreases the population of prey. Food resources become scarce when a population is large, which in turn increases competition.