Exploring Regression Analysis in Statistical Relationships
240 likes | 275 Views
Understand linear least squares, simple and multiple regression, and how to estimate relationships between variables, along with practical examples and applications in data analysis and prediction methods.

Exploring Regression Analysis in Statistical Relationships
E N D
Presentation Transcript
Linear Least Squares ELEC 413
Regression Analysis • The study and measure of the statistical relationship that exists between two or more variables • Two variables simple regression • Three or more variables multiple regression • An estimating or predicting equation isdeveloped to describe the pattern or functional nature of the relationship • A regression plane replaces a regression line in multiple regression
Regression Analysis The dependent or response variable is the variable to be estimated; customarily plotted on the vertical, or y-axis denoted by ‘y’ An independent or explanatory or regressor or predictor variable is the one that presumably exerts an influence on or explains variations in the dependent variable.
The Scatter Diagram Outputs and aptitude test results of 8 employees of a toy manufacturing company are as shown: Employee Aptitude Test Output (Dozens Results (X) of units) (Y) A 6 30 B 9 49 C 3 18 D 8 42 E 7 39 F 5 25 G 8 41 H 10 52
Simple Linear Regression Analysis • Considers a single regressoror predictorx and a dependentor response variable Y. • The relationship between x and y can be adequately described by a straight line = computed estimate of dependent variable 0 = y-intercept 1 = slope of the regression line x = a given value of the independent variable
The method of least squares is used to estimate the parameters, 0 and 1 by minimizing the sum of the squares of the vertical deviations
Employee X Y XY X2 Y2 A 6 30 180 36 900 B 9 49 441 81 2401 C 3 18 54 9 324 D 8 42 336 64 1764 E 7 39 273 49 1521 F 5 25 125 25 625 G 8 41 328 64 1681 H 10 52 520 100 2704 __ ___ ____ ___ _____ Total 56 296 2257 428 11920
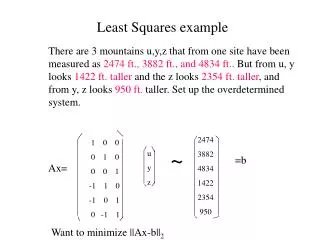
Matrix Formulation of Simple Least Squares Rewriting the two normal equations, In matrix notation,
Matrix Formulation of Simple Least Squares Recall, where
Matrix Formulation of Simple Least Squares The normal equations resulting from is given by If the matrix X TX is nonsingular, the solution for the least-squares coefficients can be found by is called a pseudo-inverse.
Polynomial Model Fit the polynomial equation tothe N pairs of data M is the degree of the polynomial The polynomial model is considered a special case of general multiple linear model
Example • Fit a parabola curve to the following data
Making Predictions with Regression Eq. Estimateor predict values of the dependent variable given values of the independent variable
Logical Reasoning Fallacy Post Hoc Ergo Propter Hoc The Trend must go on
Does a true relationship exist? A true relationship doesn’t exist if 1 is zero
Example The electric power consumed each month (y) by a chemical plant is thought to be related to x1 = the average ambient temperature, x2 = the number of days in the month, x3 = the average product purity, and x4 = the tons of product produced. The data were recorded in the table (next page). Fit a multiple linear regression model to the data and predict power consumption in a month in which x1 = 75oF, x2 = 24 days, x3 = 90%, and x4 = 98 tons.
PowerX1X2X3X4 24025 24 91 100 23631 21 90 95 29045 24 88 110 27460 25 87 88 30165 25 91 94 316 72 26 94 99 30080 25 87 97 296 84 25 86 96 267 75 24 88 110 276 60 25 91 105 288 50 25 90 100 261 38 23 89 98
Example Find c0, c1, and c2 so that the function is a least-squares fit to a triangular wave with period of 5 ms. Use a sampling frequency of 3000 Hz. Show the fit by plotting one period of the triangular wave.