Download
1 / 39
390 likes | 656 Views
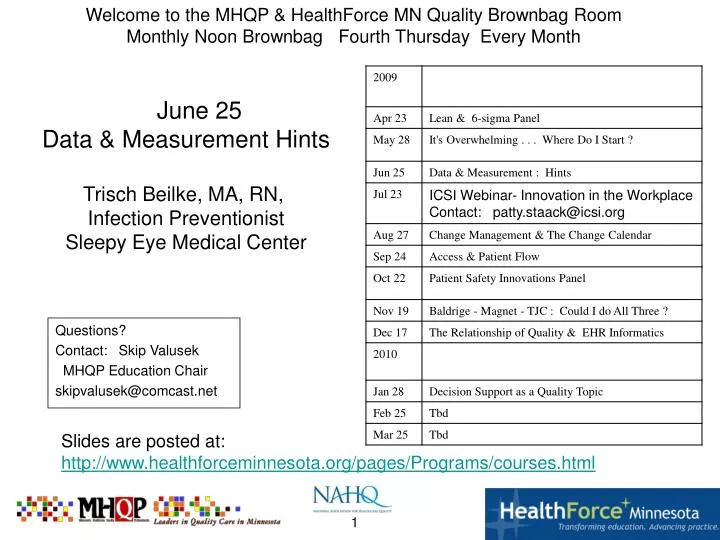
Welcome to the MHQP & HealthForce MN Quality Brownbag Room Monthly Noon Brownbag Fourth Thursday Every Month. June 25 Data & Measurement Hints Trisch Beilke, MA, RN, Infection Preventionist Sleepy Eye Medical Center. Questions? Contact: Skip Valusek MHQP Education Chair

E N D
Welcome to the MHQP & HealthForce MN Quality Brownbag Room Monthly Noon Brownbag Fourth Thursday Every Month June 25 Data & Measurement Hints Trisch Beilke, MA, RN, Infection Preventionist Sleepy Eye Medical Center Questions? Contact: Skip Valusek MHQP Education Chair skipvalusek@comcast.net Slides are posted at: http://www.healthforceminnesota.org/pages/Programs/courses.html
Hopefully you provided your name & organization when you signed in. If so: Just say Hi in the Chat Pod and we’ll capture your name and organization in the log. If not: identify yourself and organization in the Chat Pod to the left of your screen. If there are more than one attending on your sign-in, tell us how many by saying “Hi (tell us the number of attendees) “ Register your Attendance
Rural / Outstate ? Metropolitan area ? Organization that has (or serves) both ? Poll: Who is Attending this Session ?
Healthcare system Hospital Clinic or Clinic System Long term care Healthplan Homecare / Hospice A Quality Support Organization Other ? (Identify other in Chat Pod) Poll: Who is attending: Organization Type ?
1 2 3 4 5 6 7 >7 Poll: How many total participating in your room ?
I am a healthcare quality professional and am interested in additional education. I am a healthcare professional interested in developing quality skills as a core competency. I am a healthcare professional interested in learning more about healthcare quality. Poll: What do you hope to gain by participating?
Planning for Data Basic Data Concepts June 25, 2009 Brown Bag Session Trisch Beilke, MA, RN, Infection Preventionist Sleepy Eye Medical Center
Trisch Beilke, MA, RN, Infection Preventionist Sleepy Eye Medical Center About your speaker:
OBJECTIVES • At the end of this session participants will be able to: • State the difference between process and outcome measures • Recognize different types of data • Appreciate the value of operational definitions to data planning and display • Understand the basic structure and value of using control charts
Data is not all the same! BASIC CONCEPT As we plan for change, we need to understand some basic concepts to make our data the useful tool it should be. If we don’t collect the right data, in the right way it will not be useful and can actually lead us to incorrect conclusions.
BASIC CONCEPT Make sure you are measuring the right thing! Planning for data requires two questions to be answered very specifically: • What is the specific change we want to make? • (Process) 2. How will we know we have made it better? (Outcome)
There are two kinds of measures BASIC CONCEPT • Process: Think of how we do the work • How often we wash our hands • Number of ICU vent patients receiving all vent bundle cares • Waiting time in ER waiting area • Outcome: Think of the result of our work • Number of healthcare acquired infections • Number of VAPs • Number of ER walk-aways
Operational Definitions BASIC CONCEPT • Tells us what is included and excluded from our data collection bucket. • YOU decide, not necessarily universal definitions, but they need to be written and kept with the data so it is meaningful. What is it we want to count? What don’t we want to count? What can we count without breaking the bank ? What is considered a defect? How do we define and collect our sample?
Sampling Methods There are several different methods to select a sample. The following are five common methods: • Convenience Sampling—selecting the sample members based on convenience. • JudgmentSampling—selecting the sample members using the sampler’s judgment. • Systematic Sampling—selecting every Kth unit from a population or process. • PhysicalSampling—selecting the sample members using physical objects such as cards or numbered balls. • RandomSampling—selecting the sample members using a random number table or a random number generator.
Sample Data Planning Worksheet 1. What is the specific change we want to measure? New rooming process in ER 2. How will we know we have made it better? ER wait times will decrease 3. Operational Definitions: ER wait time: Time from initial presentation and triage in ER until patient is roomed. Sample: only emergent patients, not prescheduled procedures ESI Triage level 1 patients excluded. 4. What type of data will be collected? Continuous Data (Times) 5. How will the data be displayed? X & MR Control Chart 6. Who will collect the data? Trisch 7. When will it be collected? Weekly on the following Monday 8. How will it be collected? Patients will be given a time stamp sheet when they present to ER and are triaged. The nurse will time stamp again when they are roomed and collect the sheet to place in the collection container for tabulation.
BASIC CONCEPT Today’s snapshot vs. over time Sample Point in Time Display
DisplayingData Over Time Run Chart of Count Data Shows the time period your data was collected. (x - axis) Shows the thing you are interested in (y –axis)
The TYPE of data you collect dictates how it can be displayed! BASIC CONCEPT Verbatims Categorical Continuous Count YES / NO
Examples of Count Data • A straight forward count: • Number of patient falls occurred • Number of medication errors • Number of babies born in the hospital You cannot count how many have not occurred.
Examples of Yes/No Data A patient temperature is either “taken” or “not taken” An admission either “occurs” or “does not occur” A specimen is either “OK for testing” or “not OK” Yes No Can count how many have occurred, andhow many have not occurred
Examples of Continuous Data • Body weight • The time it takes to clean a patient room • Money • Blood pressure • Body temperature • Height of a person Half of a unit of measure makes sense
Examples of Unordered Categories Medication Errors: Employee Injuries: • • - Wrong drug - Slips - Wrong dose - Sharps - Wrong patient - Repetitive keyboard - Trips - Lifting Customer Complaints • - Staff was noisy at night - Cold food - Pain not managed Think of ‘buckets’ with no inherent order or rank to them
Verbatim Data Comes from interviews, customer feedback, “Describe” and other opportunities for free text on surveys, or brainstorming To display verbatim data they can be turned into categorical data using the affinity process.
Ordered Categories Please rank by order of importance __ Alternative A __ Alternative B __ Alternative C __ Alternative D Desirable Strongly Agree Somewhat agree Neutral Disagree Strongly disagree Not desirable
BASIC CONCEPT “Managing a company by means of the monthly report is like trying to drive a car by watching the yellow line in the rear view mirror.” Myron Tribus
A control chart has been called “The voice of the process” It shows the data over time 3 lines (upper, lower and middle) How do I know my process is stable over time? Control Charts
Control Charts Shows the time period your data was collected. (x - axis) Shows the thing you are interested in (y –axis)
Common cause variation is the variation inherent in the process. Special cause variation is variation due to fleeting or unusual causal factors.A statistical control chart is able to distinguish between common cause variation and special cause variation. Two Types of Variation
Rules for Detecting Special Causes The following are “rules of thumb” for determining whether there are special causes of variation present in the process: 1) A point outside the control limits 2) Seven points in a row increasing or decreasing 3) Seven points in a row above or below average 4) Obvious patterns Note: Special cause rules should in some cases be tailored for the metric. It takes a minimum of 12 data points (more is better) to have enough to tell if we have a stable process or not.
Sample Control Chart From wikipedia.com
Two Mistakes with Using Control Charts BASIC CONCEPT There are two mistakes which can be made: 1) A special cause of variation is present in the process, but it is treated as common cause variation. 2) There is only common cause variation present in the process, but action is taken on the process as if there was a special cause of variation present.
Stable, consistent, and predictable process results Allows you to learn from variation Allows you to identify special causes of variation Provides a rational basis for predicting future performance Statistical control allows prediction for future performance Benefits of Statistical Control BASIC CONCEPT
Summary: • Data is all about knowing if we have made something better. • Process measures tell us if things are being done in the way we desire; outcome measures tell us if we have made something better. • Knowing how we want to display our data is key to knowing what type of data we need to collect. • We need to have clearly defined judgments about what is counted or not counted in our data (operational definitions) • Control charts tell us and if our process is stable and predictable and project what may happen tomorrow. DATA MUST BE CAREFULLY PLANNED TO BE USEFUL!
Resources: Building Continual Improvement, SPC for the Service Sector, 2nd ed., D. J. Wheeler, S. R. Poling, SPC Press, Knoxville TN, ISBN 0-945320-58-2 How to use Control Charts for Healthcare, D. L. Kelley Making Sense of Data, D. J. Wheeler Statistical methods for Quality Improvement, H. Kume Statistics: A Self -Teaching Guide (Wiley Self Teaching Guides), D.J. Koosis http://en.wikipedia.org/wiki/Control_chart
Welcome to the MHQP & HealthForce MN Quality Brownbag Room Monthly Noon Brownbag Fourth Thursday Every Month July 23Attend the ICSI WebinarInnovation in the Work Place12:00 - 1:00 p.m. centralTo register, contactPatty Staack patty.staack@icsi.org Brownbag Questions? Contact: Skip Valusek MHQP Education Chair skipvalusek@comcast.net Brownbag Slides are posted at: http://www.healthforceminnesota.org/pages/Programs/courses.html