
Muscle Quality Measurement in Older Adults: Impacts on Neuromuscular Fatigue and Mobility
This study investigates the relationship between muscle quality, assessed via ultrasound imaging, and its association with neuromuscular fatigue (NMF) and functional mobility in older adults. Using a cohort of 15 participants aged 70.7 ± 7.3 years, we measured muscle thickness and quality of the vastus lateralis and evaluated mobility through the get-up-and-go test. Significant correlations were found between muscle quality and both NMF and mobility, emphasizing the importance of maintaining muscle health to enhance functional performance in older populations.

Muscle Quality Measurement in Older Adults: Impacts on Neuromuscular Fatigue and Mobility
E N D
Presentation Transcript
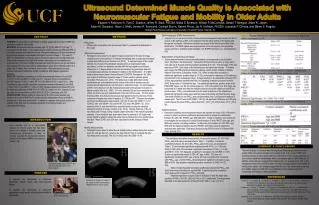
Ultrasound Determined Muscle Quality is Associated with Neuromuscular Fatigue and Mobility in Older Adults Edward H. Robinson IV, Tyler C. Scanlon, Jeffrey R. Stout, FACSM, Nadia S. Emerson, William P. McCormack, Gerald T. Mangine, Adam R. Jajtner, Adam M. Gonzalez , Adam J. Wells, Jeremy R. Townsend, Carleigh Boone, Gabriel Pruna, Jay R. Hoffman, FACSM, Leonardo P. Oliveira, and Maren S. Fragala Human Performance Laboratory, University of Central Florida, Orlando, FLUSA, • Electromyography (EMG) measurements • A bipolar (4.6 cm center-to-center) surface electrode arrangement was placed over the VL muscle of the right leg at 60% of the distance from the lateral portion of the patella and the greater trochanter. Reference electrode was placed at the lateral epicondyle of the distal femur. The EMG signals were expressed as root mean square (rms) amplitude values (µVrms) by software (AcqKnowledge v4.2, BIOPAC Systems, Inc., Santa Barbara, CA). • Determination of Neuromuscular Fatigue • Testing was performed on an electronically-braked cycle ergometer (Lode Excalibur Sport, Groningen, the Netherlands. Participants first performed a warm up stage with a work rate set at 30 watts and the participant pedaling at 50 rpm. The first stage of the test was also at 30W. Each stage of the discontinuous test lasted two-minutes. Following each stage, the EMG signal was analyzed utilizing custom-written software (LabView, National Instruments Corporation, Austin, TX). When a stage did not produce a statistically significant, positive slope (p < 0.05), an increase in resistance of 20 watts was implemented for the subsequent stage. A stage resulting in the participant achieving 75% of their age-predicted maximal heart rate, or surpassing a rating of perceived exertion (RPE, Borg scale) of 13 halted the test. If a statistically significant, positive slope of the EMG-RMS values over the two-minute stage (p < 0.05)was reached one final stage was performed at 10 watts less than the resistance that produced the statistically significant, positive slope. PWCFTwas estimated to be the mean resistance of the highest non-statistically significant positive slope and the lowest statistically significant positive slope. Test-retest reliability for the PWCFT test was determined from 7 participants measured 6 weeks apart. The ICC was 0.989 (SEM = 3.87 W). No significant difference (p>0.05) was noted between the mean PWCFT values from trial 1 (76.7 + 35.4 W) to trial 2 (71.7 + 38.8 W). • Statistical Analysis • Descriptive statistics and measurement results are reported as mean ± SD. A Pearson’s product moment correlation coefficients were calculated to assess the relationship between EI, CSA, MT, PWCFT, age, BMI and GUG. Partial correlations were employed to investigate the association EI and GUG and between EI and PWCFT when age and BMI were used as controlling variables. To determine the variables (EI, MT, CSA, Age, BMI) with the highest predictive value for PWCFT and GUG, stepwise regression analyses were performed. Data were analyzed using SPSS version 20 software (IBM Corp., Armonk, NY). Table 1.Physical characteristics, ultrasound measures, neuromuscular fatigue, and mobility of participants (n=15) ABSTRACT METHODS PURPOSE: To examine the relationship of muscle quality with the onset of NMF and functional mobility in older adults. METHODS: Fifteen older men and women (age: 70.7+7.3y; BMI: 27.3+5.6 kg.m-2) volunteered for this study. Cross-sectional area (CSA), and muscle thickness (MT) of the vastuslateralis were determined from ultrasound imaging and EI was determined by grayscale analysis using standard histogram function in ImageJ. The onset of NMF was determined from bipolar surface electrodes placed on the longitudinal axis of the vastuslateralis of the right thigh during a discontinuous incremental cycle ergometer test. Functional mobility was assessed using the get up and go test (GUG) that measured the time (seconds) for participants to stand from a seated position in a chair, walk 3-meters, turn, walk back, and sit down. Data were analyzed using Pearson correlation coefficients, partial correlations, and stepwise regression analyses. RESULTS: Significant correlations (p<0.05) were observed between EI and GUG (r=0.62; p<0.05) and NMF (r= -0.68; p≤0.01). However, EI was not significantly (p>0.05) related to CSA (r= -0.44), MT (r=-0.30), BMI (r=0.02) or age r=0.21). After controlling for age and BMI, significant correlations remained between EI and GUG (r=0.69, p≤0.01) and NMF (r= -0.66; p<0.05). Stepwise regression indicated EI to be the single best predictor of NMF (R=0.67, SEE=22.0 watts, p<0.01), however, EI and age were the best predictors of GUG (R=0.86, SEE=1.3 seconds, p<0.001). CONCLUSIONS: Muscle quality as measured by EI of the vastuslateralis was related to the onset of NMF and functional mobility independent of age and BMI in this sample of older men and women. In addition, it appears that muscle quality, not quantity (CSA, MT), was the strongest predictor of functional mobility and neuromuscular fatigue. • Participants • Fifteen older, but healthy men and women (Table 1) volunteered to participate in this study. • Ultrasound measurement • Participants were asked not to perform vigorous exercise 72 hrs prior to image collections and a rest period of 15 minutes immediately prior to scan was mandated to allow fluid shifts to occur (Cadore et al, 2012). To capture images of the vastuslateralis (VL) muscle, the participant was placed on an examination table, recumbent, on their non-dominant leg side with the legs together and relaxed allowing for a 10 degree bend in the knee as measured by goniometer and with toes angled approximately 45 degrees in relation to the frontal plane. A 12 MHz linear probe scanning head (General Electric LOGIQ P5, Wauwatosa, WI, USA) with a gain of 50dB and a dynamic range of 72 was used to optimize spatial resolution (Thomaes et al., 2012). The probe was coated with water soluble transmission gel and positioned on the surface of the skin to provide acoustic contact without depressing the dermal layer to collect the image. VL was measured at 50% of the distance from the most prominent point of the greater trochanter to lateral condyle (Abe et al., 1998). For echo intensity (EI) and cross-sectional area (CSA), the probe was held perpendicular to the axis of the muscle. For the muscle thickness (MT), the ultrasound probe was held parallel to the muscle body. Three consecutive images were taken to analyze EI, CSA and MT. The same investigator performed all ultrasound measurements. (ICC) for EI was 0.93 (SEM = 5.1), for CSA ICC was 0.99 (SEM=1.26), and for MT, ICC was 0.89 (SEM= .12). Echo intensity of the VL was determined by grayscale analysis using the standard histogram function in ImageJ (Cadore et al., 2012). Muscle thickness of the VL was measured in ImageJ using a digital caliper at the site of the muscle’s greatest diameter. Cross sectional area scans were taken by a sweep in LV (logiq view) mode, medial to lateral to obtain the entire muscle, transverse to the muscle tissue interface. Mean EI, MT, and CSA were calculated from the average of three images. • Mobility Measurements • Participants were asked to stand from a seated position, without using their arms to push off, walk ten feet turn, return to the chair and sit. Time to complete the task was measured in seconds. The ICC for GUG was 0.81 (SEM = 0.41). Table 2.Correlation coefficients between ultrasound measures, neuromuscular fatigue, physical characteristics, and mobility of the participants (n=15) Table 3.Partial correlation coefficients between EI, neuromuscular fatigue and mobility. (n=15) INTRODUCTION • Echo intensity (EI) is a non-invasive measure of muscle quality that has been shown to be related to strength, power and cardiovascular performance. To date, no one has explored the relationship between neuromuscular fatigue (NMF) and functional mobility to EI. Table 4.Factors associated with mobility and Neuromuscular Fatigue RESULTS * The participant descriptive characteristics, ultrasound measures (EI, MT, CSA), PWCFT and GUG values are presented in Table 1. In addition, Correlation coefficients between (EI, MT, CSA), PWCFT and GUG values are presented in Table 2. EI demonstrated significant relationships with PWCFT (r= -0.68) and GUG (r=0.62) while CSA revealed a significant association to PWCFT (r= 0.64) and BMI (r= 0.55). MT displayed a significant, correlation only with BMI (r= 0.57). EI was not significantly related to CSA, MT, age, or BMI. CSA was not significantly correlated to MT, age, or GUG. MT was not significantly correlated with PWCFT, age, or GUG. PWCFT demonstrated no significant correlation to age, BMI or GUG. Age showed a significant, positive correlation to GUG (r=0.72) only. Table 3 shows the partial correlation coefficients between EI, PWCFT and GUG when when controlling for age and BMI. A significant partial correlation exists between EI compared to PWCFT and GUG. Stepwise regression analysis (Table 4) indicated EI was the single best predictor of PWCFT (R=0.67, SEE=22.0 W, p<0.01). Additionally, EI and age were identified as the best predictors of GUG (R=0.86, SEE=1.3 sec, p<0.001). SUMMARY & CONCLUSIONS The main findings in this study were the significant relationships between muscle quality (MQ) of the vastuslateralis as measured by EI, to the onset of NMF and functional mobility in older adults (Table 2). Furthermore, these results continued to demonstrate significant relationships when controlling for age and BMI (Table 3). In addition, these data also suggest that muscle quality, not quantity (CSA, MT), is the strongest predictor of functional mobility and neuromuscular fatigue in this sample of healthy older adults. Our findings suggest that the use of EI may provide a low cost and reliable measure of MQ that may contribute to future studies examining functionality and fatigue in older populations. Participant engaged in the PWCFT test with electrode placement on the vastuslateralis PURPOSE REFERENCES To examine the relationship of ultrasound determined muscle quality with neuromuscular fatigue. To examine the relationship of ultrasound determined muscle quality with functional mobility in older adults. Examples of ultrasound images of the vastuslateralis demonstrating different levels of muscle quality. Cadore, E. L., Izquierdo, M., Conceição, M., Radaelli, R., Pinto, R. S., Baroni, B. M., ... & Kruel, L. F. M. (2012). Echo intensity is associated with skeletal muscle power and cardiovascular performance in elderly men. Experimental Gerontology. Fukumoto, Y., Ikezoe, T., Yamada, Y., Tsukagoshi, R., Nakamura, M., Mori, N., ... & Ichihashi, N. (2012). Skeletal muscle quality assessed from echo intensity is associated with muscle strength of middle-aged and elderly persons. European journal of applied physiology, 112(4), 1519-1525. Shumway-Cook, A., Brauer, S., & Woollacott, M. (2000). Predicting the probability for falls in community-dwelling older adults using the Timed Up & Go Test. Physical Therapy, 80(9), 896-903. • Capturing ultrasound images • of the vastuslateralis.


