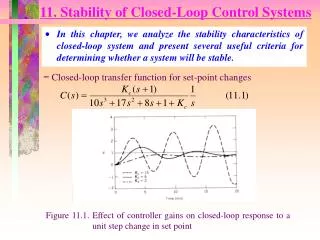
Understanding Strong Field Closed Loop Learning Control Experiments
Understanding Strong Field Closed Loop Learning Control Experiments. PRACQSYS August 2006. +. =. Motivation and Outline. Want to understand strong field learning control (closed loop) Single atom vs collective dynamics From atoms to molecules - controlling fragmentation.

Understanding Strong Field Closed Loop Learning Control Experiments
E N D
Presentation Transcript
Understanding Strong Field Closed Loop Learning Control Experiments PRACQSYS August 2006
+ = Motivation and Outline • Want to understand strong field learning control (closed loop) • Single atom vs collective dynamics • From atoms to molecules - controlling fragmentation
The ‘Coherent’ Control Toolbox Amplified ultrafast lasers Optical field control Feedback and learning algorithms • Output: • = 3*10-14s Energy = 10-3J • Icontrol(1018W/m2)>> Isun(6*107W/m2) Control E() ~1000 ‘knobs’
Stark shift: Without Stark shift wo wo With Stark shift Strong Field Population Inversion Na energy levels |4s> 1141 nm |3p> 777nm 589 nm |3s> • Coupling strength • and energy shifts are • of the same order of • magnitude -> low • efficiency • Absorption -> Emission P|4s> R. R. Jones PRL74, 1091 (1995)
Experimental Setup Pulse shaper Sodium vapor T ~ 3500 C Pinhole Lens Na Cross correlation G.A. 589 nm Laser Dt = 30 fs l0 = 772 nm - 784 PMT PMT Na energy levels |4s> 1141 nm 777 nm |3p> 589 nm |3s>
Feeding back on Stimulated vs Spontaneous emission Spontaneous Emission Stimulated Emission Improvement over unshaped ~ 3 Improvement over unshaped ~ 103
Understanding Single Atom Dynamics I I(t) and (t) --- 0=784 nm 0=772 nm 0=777 nm All solutions give substantial improvement over an unshaped pulse – but only for strong fields! C. Trallero-Herrero et al Phys. Rev. Lett. 96 063603 (2006)
Understanding Single Atom Dynamics II Need to maximize: …but with constraints. 2 P4s(t),(t) shaped P4s(t), (t) unshaped I(t)
Understanding Increase in Stimulated Emission Yield • Solve coupled Schroedinger • and Maxwell Equations • Time and Frequency domain • Measurements of Stimulated • Emission D. Flickinger et. al. Applied Optics 45 6187 (2006)
Modeling Collective Behavior Na energy levels |4s> (Q22) After laser field 1141 nm = e1 777 nm |3p> (Q33) 589 nm = e2 |3s> (Q11) M. Spanner & P. Brumer PRA 70 023809 (2006)
Simulation Results Intensity [arb] Time [ps]
Measurement of the Stimulated Emission Experiment Theory
Superfluorescence (Yoked) Cross correlation of Stimulated Emission • Delayed pulse – not a • parametric process • t<1(~0.5) – almost • perfectly coherent • - not ASE M. S. Malcuit et. al. PRL59 1189 (1987)
Stimulated Emission vs |4s|2 Experiment Theory Note threshold at 2/3 • Stimulated emission is superfluorescence • – locking of dipole phases in ensemble • Control is through optimizing single atom • inversion to get over SF threshold
CF3+ Shaped Pulse CH3+ Unshaped Pulse Control in Trifluoroacetone CH3COCF3 Control goal = CF3+/CH3+ R. J. Levis, G. M. Menkir, and H. Rabitz, Science 292, 709 (2001). D. Cardoza, M. Baertschy, T. Weinacht, J. Chem Phys. 123, 074315 (2005).
τ =170 fs Intensity Phase (radians) τ Time (fs) Optimal solution and Pump-Probe Measurement CF3+ yield vs pump-probe delay A~170 fs B~85 fs A B All other fragments flat Laser cooperates with Molecular dynamics
Ab initio structure & wave packet calculations help reveal mechanism CH3COCF3+ CF3 + CH3CO+
Control Model Wave packet takes 145-175 fs to reach EI point. Pump- Probe peak is ~170 fs 1 • Ionization (launch) • Wave packet evolution • Enhanced ionization 2 1 Energy[eV] 3 C-C-O angle [degrees] C-CF3 bond length [Å] J. Chem. Phys.123 074315 (2005)
Predictions for ‘Family Members’ CH3COCF3 CH3COCCl3 CH3COCD3
CH3COCF3 CH3COCCl3 CH3COCD3 Fragmentation of Family Members
Results for CH3COCCl3 and CH3COCD3 Control Pulse Shape Pump-probe Chemical Physics Letters411, 311 (2005)
General techniques for interpreting control: What are the right knobs?
Transforming from ‘bad’ to ‘good’ bases Can a given linear transformation, T1, diagonalize entire search space? x1 x2 For linear transformations, PCA – J. Phys. B37 L399 (2004)
Physically Motivated Basis Transformation in CH3COCF3 Journal of Chemical Physics,122, 124306 (2005)
Conclusions & Future Directions • Demonstrated closed loop coherent control over strong field dynamics • Both quantitative and qualitative understanding of both stimulated emission and single atom dynamics • Understand control in a molecular family – ‘photonic reagents’
Acknowledgements David Cardoza Carlos Trallero Sarah Nichols Daniel Flickinger Brendan Keller Brett Pearson Jay Brown Collaborators: Mark Baertschy (CU Denver) Jayson Cohen (Focus, U Michigan) Michael Spanner (Toronto) Herschel Rabitz (Princeton) Funding: NSF, ACS-PRF, DURIP & Research Corp