Download
1 / 24
240 likes | 367 Views
Exploiting Genome Comparison for Gene Structure Prediction in Plants. Ping Hu Michael Brent Lab Washington University at St. Louis. Twinscan. One of the most accurate gene finders Exploits evolutionary conservation in genomic sequence Adapted to high throughput analysis.

E N D
Exploiting Genome Comparison for Gene Structure Prediction in Plants Ping Hu Michael Brent Lab Washington University at St. Louis
Twinscan • One of the most accurate gene finders • Exploits evolutionary conservation in genomic sequence • Adapted to high throughput analysis
Gene Finding Approaches • Alignment based • Pure protein homology (TBLASTN) • Pure genomic homology (TBLASTX, Exofish) • Ab initio (Genscan, GeneMark, FgeneSH) • Combined • Ab initio + protein homology (Genomescan) • Ab initio + genomic homology (Twinscan, sgp2)
TWINCAN Probability Model • Model Assigns each nucleotide to one of the seven categories: 3U, 5U, E, I, polyA, N, Pro UUUUUUUUUUUUEEEEEEEEEEEIIIIIII 5’TTTTACAGGACCATGCTACACCGGTGGATT3’ Assign probability toeach parsed DNA • Optimization Given a DNA sequence, find the annotation that maximizes the joint probability
Explicit State-Duration HMM • Each state corresponds to a category • Model “annotates” DNA by passing through states • Algorithm find the most probable path
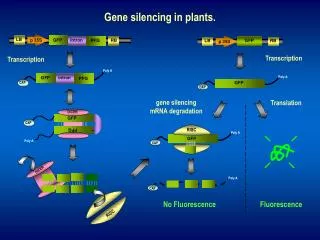
Conservation Sequence • TWINSCAN integrates information about the degree and pattern of evolutionary conservation at each nucleotide • Intron, intergenic, UTRs, regulatory sites, splice sites and CDS evolve under distinct selective pressures, leaving distinct imprint on locale patterns of conservation • Conservation sequence: models the similarity of a target sequence to another genome (informant)
Conservation Sequence • Align homologous regions using BLAST • Each target nucleotide is paired with one of the 3 conservation symbols, determined by the highest scoring local alignment • “.” : unaligned • “|” : aligned and identical • “:” : aligned to mismatch or gap ATTTAGCCTACTGAAATGGACCGCTTCAGCATGGTATCC ||:|||.........|:|:|||||||||:||:|||::|| • Independent conservation probabilities
A. thaliana Data Sets and Informant • Arabidopsis sequences and cDNA confirmed annotations from TIGR, 7,834 genes, 33,349 exons • Merged Set: each ~500 kb, total 35Mb • Brassica is closely related to Arabidopsis • 87% sequence identity of homologous genes • Brassica oleracea (cabbage) Informant: from TIGR, 34,857 sequences, 223 Mb
Statistic Definition Correctly Predicted Sensitivity = ----------------------------------- Annotation Correctly Predicted Specificity = ------------------------------- Total Predicted
Results on Merged Set GeneMark Twinscan Ts_no_Con Genscan Nuc Sn96.3 94.2 91.7 87.0 Nuc Sp 80.0 81.9 81.4 78.2 Exon Sn 79.2 81.3 75.2 61.5 Exon Sp 66.6 72.2 68.4 58.8 Gene Sn 38.4 51.3 42.9 19.2 Gene Sp 32.2 38.8 31.9 20.2
Results on Whole Genome GeneMark Twinscan TS_no_Con Genscan Nuc Sn96.6 94.2 92.2 87.1 Nuc Sp 20.1 21.8 21.0 19.1 Exon Sn 79.6 81.3 76.0 61.4 Exon Sp 20.1 22.4 20.8 17.3 Gene Sn 39.7 51.2 43.4 19.6 Gene Sp 11.6 12.7 10.1 6.7
Gene Boundary: Merged GeneMark Twinscan TS_no_Con Genscan Start&Stop 4174 5179 4780 2235 S&S Sp 44.6 50.0 45.5 30.0 S&S Sn 53.3 66.1 61.0 28.5
Gene Boundary: Whole Genome GeneMark Twinscan TS_no_Con Genscan Start&Stop 4302 5161 4774 2241 S&S Sp 16.0 16.4 14.2 9.8 S&S Sn 54.9 66.0 60.9 28.7
Conclusion • Twinscan out performs GeneMark.hmm and Genscan • Better gene boundary prediction • Conservation sequences improve performance
Future Direction Arabidopsis & Brassica • Allow alternative splice donor and acceptor sites • 5’ donor site : GT to GC, AT • 3’ acceptor site :AG to CT • Improve the UTR model • conservation gradient
Future Direction Rice Genome • Informant genome : Arabidopsis, Maize • shotgun reads • ESTs/cDNA • Tune parameters for rice • Example : Intron length • Example: Average GC level (43% vs 36%) • Incorporate the GC gradient
Integrate GC Gradient • Assigns each nucleotide to a GC level in window of 129 nucleotide 555555555555555777666666655555555555555 ATTTAGCCTACTGAAATGGACCGCTTCAGCATGGTATCC ||:|||.........|:|:|||||||||:||:|||::|| • Estimate separate probability distributions for 1st Exon, 2nd Exon … • May help identify start codon and the exon/intron boundary
Acknowledgement • Mosanto • Janice Edwards • Lesley Tomlin • Jingdong Liu Advisor • Michael Brent Brent Lab • David Shteynberg Collaborators • Chris Town (TIGR) • Brian Haas(TIGR)