Download
1 / 1
Neural Cell Marker Expression Variations in Cellular Protein Extracts
10 likes | 97 Views
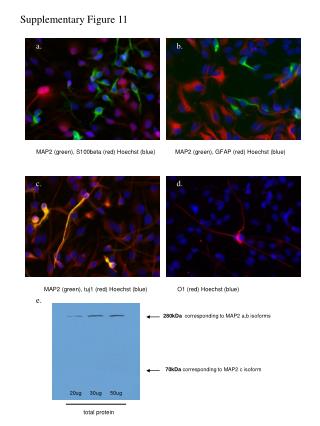
Immunofluorescence analysis showing MAP2, S100beta, GFAP, Tuj1, and O1 protein expressions in neural cells with corresponding weights of total protein extracts.
Download Presentation 
Neural Cell Marker Expression Variations in Cellular Protein Extracts
An Image/Link below is provided (as is) to download presentation
Download Policy: Content on the Website is provided to you AS IS for your information and personal use and may not be sold / licensed / shared on other websites without getting consent from its author.
Content is provided to you AS IS for your information and personal use only.
Download presentation by click this link.
While downloading, if for some reason you are not able to download a presentation, the publisher may have deleted the file from their server.
During download, if you can't get a presentation, the file might be deleted by the publisher.
E N D
Presentation Transcript
Supplementary Figure 11 a. b. MAP2 (green), S100beta (red) Hoechst (blue) MAP2 (green), GFAP (red) Hoechst (blue) c. d. MAP2 (green), tuj1 (red) Hoechst (blue) O1 (red) Hoechst (blue) e. 280kDa corresponding to MAP2 a,b isoforms 70kDa corresponding to MAP2 c isoform 20ug 30ug 50ug total protein


More Related