Download
1 / 31
340 likes | 557 Views
Mapping Protein-Protein Interactions. MEDG 505 (Genome Analysis) 13 January 2005. •Morin: -Overview -IP-MS -Data integration •Student presentations: -Y2H interactions -RNA vs Protein expression analysis •Discussion: -Lessons -Application. Central Dogma.

E N D
Mapping Protein-Protein Interactions MEDG 505 (Genome Analysis) 13 January 2005 •Morin: -Overview -IP-MS -Data integration •Student presentations: -Y2H interactions -RNA vs Protein expression analysis •Discussion: -Lessons -Application
Central Dogma DNA RNA Protein Function Humans: - ~25,000 genes - 25-40% with functional annotations General Goal: Annotation of proteome -Identify disease related proteins -Identify therapeutic targets How identify protein functions?
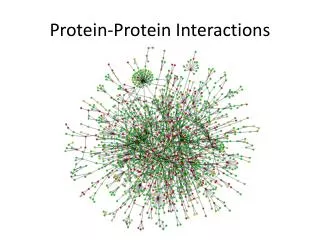
Protein Function General purpose of proteins is to interaction with other molecules -Enzyme/substrate -Protein/protein Cellular processes governed by complex networks of interacting proteins -Determination of protein-protein interactions infers functional hypotheses
Protein Annotation -can verify biological role -binary interactions -often protein fragments -high false positives -extensively employed -comprehensive and HTP -mRNAs infer proteome -identifies expression changes -silent to PTMs -cause and effect difficult to infer -interactions difficult to predict -verifies biological role -translation to humans problematic -differences in biology cloud interpretation -identifies interactions directly -yields higher order interactions -identifies PTMs -binding affinity can be employed -technically challenging Lesson: All methods need to be employed to fully annotate proteome. Large Scale Methods for annotation of protein function: -Genetic -Mutational analysis in model organisms -Yeast 2-hybrid -Genomic -mRNA profiling -Biochemical -MS analysis of purified protein complexes
IP-MS Immunoprecipitation - Mass Spectrometry
Protein identification LC-MS/MS fragmentation Excise bands Gel separation
Tagged Protein Structure CMV N-tagged construct CMV lox lox FLAG ORF C-tagged construct lox ORF lox FLAG
Properties of Immunoprecipitated Protein Complexes Experimental design and analysis should be designed for expectations Methodology for evaluation 1-Experimental validation 2-Bioinformatic evaluation 3-Experimental reproducibility -transfection/IP protocols Types of interacting proteins • Background binding to bait/matrix/MS (filter?) • Proteins from throughout lifespan • Processing/transport/degradation proteins (filter?) • Weak affinity (less reproducible?) • Strong affinity • Primary interactors • Secondary interactors • High data volume
Method Characterization Characterization Project 1- 49 Baits, from diverse protein families -tag both N and C termini 2- IP-MS, repeat 4+ times 3- 190 preys -hit: -observed 2+ times -frequency less than 5% 4- Analyze
N- & C-Tag Hit Overlap Sample 33 Baits • Lessons: • 5 Hits per Bait. • N-tags interfere less than C-tags. • Both tags needed to get good representation.
Prey Reproducibility Note: ~50% of C-tags have 1.0 rate. Lesson: Improve immunoprecipitation conditions. Question: How many trials to see a prey 2 times? Sample 42 Baits 190 Preys
Planning Trial Size Binomial distribution equation p: prey observation frequency n: number of trials k: number of observations required (2) Rate = 0.5 2 trials 3 trials Lessons: •Identifies suspect data •Improving reproducibility rate reduces number of trials needed. H H H T H H H H T H T H H T H T T T T H H T H T T H T T T H T T Lessons: •Identifies suspect data •Improving reproducibility rate reduces number of trials needed. Note: •If hit = 3+ times then probability = 0.125
False Negative Rate Lesson: •1 or 2 trials provides highly incomplete dataset.
Predicted False Positive Rate < 0.05 p: prey observation frequency n: number of trials k: number of observations required (2) Efalsepositive: expected number of false positives cutoff: frequency cutoff Numhits(p): number of hits at each prey observation frequency “safe” region 5% Method -determine prey frequency in database -Assume background proteins have a uniform random distribution -Assume background does not change with time or experimental conditions -Compare prey frequency to predicted observation rate False positive frequency PathMap (global) observation frequency
Estimated Experimental False Positive Rate Random Sampling Method -randomly reassign bait labels for each IP for all 49 baits -repeat -obtain 3, 4, and 5 trial sets, 49 baits each, with preys randomly assigned to a bait (5% database frequency) -assume random distribution (no relation between baits) Results Reasons -not independent experiments -non-random -baits are related -cross-contamination -equipment contamination -false positive rate 2-3X greater than calculated. -non-uniform distribution
Managing False Positives 1-Control subtraction -empty vector immunoprecipitation -irrelevant protein immunoprecipitation 2-Reproducibility -2+ times -3-4 biological replicates 3-Database frequency -observation frequency cutoff 4- Prioritization -annotation 5-Validation -reciprocal immunoprecipitation -co-expression
Human Pathway Pilot Project TNFa pathway -Proinflammatory cytokine expressed mainly by activated monocytes and macrophages -Highly studied -Pathway members provide ready availability of baits. -Understanding incomplete, providing opportunity for discovery -Disease involvement -Tumor progression and killing -Diabetes -Infection -Inflammation -Pharmaceutical potential -Find protein targets that perform isolated TNFa functions without side-effects. Contract design: -20 baits, chosen by customer (17 actually provided) -N & C FLAG tags, constructed by MDSP. -Report all observed interactions. Additional design parameters: -Expressed and immunoprecipitated 4 times each. -Report all interactions classified as hits.
TNFα Pathway: Inflammation/Cancer with Preys - 17 Baits - Both N & C tags - 4 Immunoprecipitations
TNFa Pathway Project Summary Potential antibody targets
Genes Regulating Cell Growth and Division • Systematic identification of pathways that couple cell growth and division in yeast • Science297: 395-400, 2002. • Paul Jorgensen • Joy L. Nishikawa • Bobby-Joe Breitkreutz • Mike Tyers • Program in Molecular Biology and Cancer • Samuel Lunenfeld Research Institute • Mount Sinai Hospital • Toronto, Ontario, Canada
Genetic Screen for Yeast Size Mutants whi lge 4812 strains (~2 yrs) Wild type size profile sfp1 whi lge 10 35 60 85 110 Cell volume (fL)
WT GALSFP1 SFP1 GAL genes (10) Nucleotide biosynthesis (12) tRNA synthetases (6) ribosome biogenesis (21) RNA Polymerases I and III (10) nucleolus (29) Translation initiation and elongation (17) Ribosomal protein genes (136) scale 5 3 1.5 -1.5 -3 -5 SFP1 regulated genes
Yeast Interaction Map Ho et al. Nature10:180-3, 2002. -aFLAG IP > LC-MS/MS -725 bait attempts -493 baits > 1578 preys -646 unannotated preys
Overlap of Genetic, Expression & Interaction Data Common mRNA regulation Protein interactions Genetic interaction Nucleolar Network
Gene Regulation in Breast Cancer 98 breast tumors x 25000 genes “genes that are overexpressed in tumors with a poor prognosis profile are potential targets for the rational development of new cancer drugs” Proteins in the functional pathway of disease associated genes may identify additional or better therapeutic targets. 231 430 2460 van’t Veer et al. (2002) Nature415, 530-6.
Overlap of PathMap and Breast Cancer Genes van’t Veer et al. (2002) Nature415, 530-6.
Protein Networks in Prognosis Reporters enzyme 55 + 35 only up regulated 4 down regulated 16 Interaction network provides context
Integrated Genomic/Proteomic Breast Cancer Project •Profile gene expression changes during tumor progression •Assemble experimental gene set -genes with expression changes -genes suspect for breast cancer progression •Perform IP-MS to determine interacting proteins •Analyze for regulatory networks and critical pathways van’t Veer et al. (2002) Nature415, 530-6.