Download
1 / 8
80 likes | 156 Views
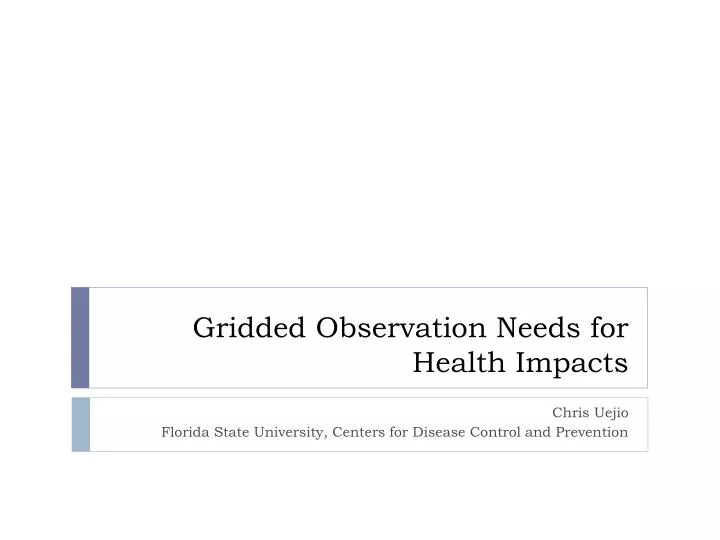
Gridded Observation Needs for Health Impacts. Chris Uejio Florida State University, Centers for Disease Control and Prevention. Extreme heat health survey. 70 municipalities O’Neill et al. (2010)

E N D
Gridded Observation Needs for Health Impacts Chris Uejio Florida State University, Centers for Disease Control and Prevention
Extreme heat health survey • 70 municipalities O’Neill et al. (2010) • ‘‘Regularly review weather forecast information for the purpose of preparing for excessive heat events’’ 36% Most common heat response
“My health department has ample expertise to assess public health impacts associated with climate change” Balbus et al. 2008
Over the next 20 years, climate change will make the following Extreme Heat Air Pollution Fresh Water Drought Storms, Floods Vectorborne
Chris’s Anecdotes • Drought • Many studies use information from one weather station • Public health difficulty working with gridded binary & NetCDF data • Not supported by SAS • Reluctance to use, trouble applying • Weather types, ENSO • Atmospheric moisture
Reluctance, trouble atmospheric moisture Survival Shaman & Kohn (2009)
National Environmental Public Health Tracking Network • Aggregates human health, weather, & vulnerability • Web-based tool • http://ephtracking.cdc.gov/showHome.action • North American Land Data Assimilation System Forcing • Aggregated to the county level • Various extreme heat metrics, precipitation
Daily Comparison: Scatter plot by Climate Region NLDAS-based maximum temperature (F) Station-based maximum temperature (F) Comparison for May – September 2006 Courtesy of Ambarish “Rish” Vaidyanathan, CDC EnvtHealth Tracking