Download
1 / 49
490 likes | 821 Views
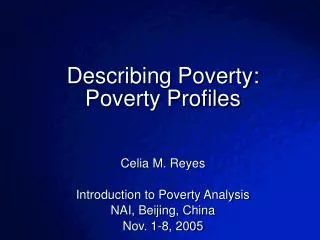
Describing Poverty: Poverty Profiles Celia M. Reyes Introduction to Poverty Analysis NAI, Beijing, China Nov. 1-8, 2005. Poverty Profiles. A poverty profile sets out the major facts on poverty (and, typically, inequality), and then examines the pattern of poverty, to see how it varies by

E N D
Describing Poverty: Poverty Profiles Celia M. Reyes Introduction to Poverty Analysis NAI, Beijing, China Nov. 1-8, 2005
Poverty Profiles • A poverty profile sets out the major facts on poverty (and, typically, inequality), and then examines the pattern of poverty, to see how it varies by • geography (by region, urban/rural, mountain/plain, etc.), • by community characteristics (e.g. in communities with and without a school, etc.) • by household characteristics (e.g. by education of household head, by size of household). 7. Describing Poverty
Poverty Profiles • A "poverty profile" is simply a special case of a poverty comparison, showing how poverty varies across sub-groups of society, such as region of residence or sector of employment. • A poverty profile can be extremely useful in assessing how the sectoral or regional pattern of economic change is likely to affect aggregate poverty. 7. Describing Poverty
100 Headcount index (+/- 2 std errors) 80 Share of total 60 40 20 0 Phnom Penh Other Urban Rural Figure 7.1 Headcount Poverty by Region
Table 7.1 Some Characteristics of the Poor in Ecuador, 1994
Table 7.2: Poverty among various household groups in Malawi, 1997/98
Poverty Profiles • The general rule is that all variables that correlate with poverty and are relevant for policies under consideration should be included. Thus, income generating activities, asset positions, access to social and infrastructure services, and the composition of consumption are all of interest. Cross-links to non-income measures of poverty may also be useful. 7. Describing Poverty
Additive Poverty Profiles • Additive poverty measures can greatly facilitate such poverty comparisons. Consider the general class of additive poverty measures. Suppose the population can be divided into m mutually exclusive sub-groups. The poverty profile is simply the list of poverty measures Pj for j=1,..,m. Aggregate poverty can then be written as the population weighted mean of the sub-group poverty measures: 7. Describing Poverty
Additive Poverty Profiles where is the poverty measure for the j'th sub-group with population Nj, having yij as the welfare indicator of individual i who belongs to the sub-group j for i=1,..,Nj, and the total population is N = 7. Describing Poverty
Additive Poverty Profiles • Analogously, one can also define "clusters" of sub-groups; as one disaggregates further and further, the poverty profile at each step adds up to that of the previous step, using population weights. • In addition to the computational convenience of additive poverty measures in forming poverty profiles, additivity guarantees "subgroup consistency" in that when poverty increases (decreases) in any sub-group of the population, aggregate poverty will also increase (decrease). 7. Describing Poverty
Additive Poverty Profiles • An evaluation of the effects on aggregate poverty of targeted poverty alleviation schemes - whereby the benefits are concentrated in certain sub-groups - may be quite misleading unless the poverty measure used has this property. • The measure of aggregate poverty may show an increase even if poverty fell in the target group, and there were no changes elsewhere. • Subgroup consistency can thus be viewed as a desirable property in evaluating anti-poverty policies. 7. Describing Poverty
Additive Poverty Profiles • A possible objection to additivity is that it attaches no weight to one aspect of a poverty profile: the differences between sub-groups in the extent of poverty. • Consider two equal sized groups - "rural" and "urban" sectors - with initial poverty indices 0.70 and 0.20 respectively. Aggregate poverty is 0.45 according to any (population weighted) additive measure. 7. Describing Poverty
Additive Poverty Profiles • One is to choose between two policies X and Y. • under policy X, the poverty profile changes to 0.70 and 0.10 • under policy Y, the profile becomes 0.60 and 0.20. • By any additive poverty measure one should be indifferent between X and Y since both yield an aggregate poverty index of 0.40. • Yet, in contrast to X, the gains under policy Y have gone to the poorer rural sector. 7. Describing Poverty
Additive Poverty Profiles • Should we prefer policy Y? • YES, if one is concerned about inequalities between groups independently of absolute living standards. 7. Describing Poverty
Profiles Presentation • Two main ways of presenting a poverty profile: • Type A: gives the incidence of poverty or other poverty measure(s) for each sub-group defined in terms of some characteristic, such as place of residence • Type B: gives the incidence of characteristics amongst sub-groups defined in terms of their poverty status, such as "poor" and "non-poor" 7. Describing Poverty
Profiles Presentation • Which is more useful will depend on the purpose of the poverty profile. • Suppose that one is using the poverty profile to select a target region for a poverty alleviation scheme. The scheme will allocate a small sum of money to all residents in the chosen target region. This is an example of what is sometimes called "indicator targeting". 7. Describing Poverty
Profiles Presentation • It is "imperfect" targeting because the policy maker does not know who has which standard of living even when a distribution of living standards can be constructed from a household sample survey; thus the policy maker relies on an imperfect indicator of living standards, in this case region of residence. • In this case, a type A profile will be more useful since it identifies the areas (or groups) where poverty rates are highest, and hence where universal cash transfers are least likely to be handed out to the non-poor. 7. Describing Poverty
Poverty Comparisons over Time • Changes in income over time requires poverty measures that are comparable and that reflect differences over time in the cost of living across regions. • The most common method for preparing comparisons over time consists of converting nominal income or consumption data from different surveys and regions into real income and consumption by deflating the indicators in space and time. 7. Describing Poverty
Poverty Comparisons over Time • Constant poverty line can then be applied to these real values to infer poverty measures. • Ideally, to obtain robust poverty comparisons over time, one would want to use surveys with similar sampling frame and methods, with corrections for prices differences, and with similar definitions of consumption or income. • However, in practice, differences exist in some of these dimensions but this does not imply that no comparison can be made. 7. Describing Poverty
Poverty Comparisons over Time • Thus, the analyst will need to: • correct for major differences in the sampling frame and sapling method for the different surveys or the different rounds of a panel survey; • Use regional and temporal price indices to ensure a similar definition of the poverty line over time and across regions. 7. Describing Poverty
Poverty Comparisons over Time • Adjust definition of consumption or income aggregates over time to ensure a similar definition is used to avoid important distortions of poverty measurement. • The analyst can investigate changes in the regional distribution of poverty or in the major characteristics of the poor, such as ethnicity, gender, age, urban and rural location, employment, access to social programs and basic services, etc. 7. Describing Poverty
Poverty Comparisons over Time • Although the various population groups identified in the first period of time should clearly form the basis of the analysis over time, it is also important to investigate whether or not ‘new’ groups of poor people have appeared. • This is particularly relevant for countries that undergo rapid changes linked to such factors as economic reforms, conflicts, natural disasters, and epidemics such as HIV/AIDS. 7. Describing Poverty
Poverty Comparisons over Time • For example, comparing the baseline poverty profile for Cambodia derived from the 1993/94 data with that of the CSES 1997 suggests that the food poverty line increased from 1,578 to 1,819 riels per day in Phnom Penh (15%), from 1,264 to 1,407 riels per day in other urban areas (11%K), and from 1,117 to 1,210 riels (8%) in rural areas. 7. Describing Poverty
Poverty Comparisons over Time • Changes in the characteristics of different poverty groups can be looked at. For example, the distribution of access to services in the base year can be compared with the distribution of services in the second year. This will then show whether changes made in the supply of the services have been pro-poor. • Poverty measures sometimes are translated into the relative risks of being poor for different household groups. 7. Describing Poverty
Poverty Comparisons over Time • Relative risks indicate whether the members of a given group are poor in relation to the corresponding probability for all other households of society. • This concept may be applied to examine whether, over time, the relative poverty risk of specific population groups decreases or increases. 7. Describing Poverty
Table 7.4 Peru: Poverty Risks for Selected Groups of Households, (%)
Indonesia • Results are given for the three main poverty measures discussed: • Assumed an urban-rural cost-of-living differential of 10% which appears to be reasonable though lower than what has been assumed in most other poverty profiles for Indonesia. 7.5 Poverty Profiles for Indonesia and Cambodia
Indonesia • The poverty measures are based on the estimated population distributions of persons ranked by household consumption per person, where each person in a given household is assumed to have the same consumption. Household specific sampling rates have been used in estimating the distributions. • The 3 measures are in close agreement on the ranking of sectors in terms of poverty, very few re-rankings. For example, the two farming sub-groups are the poorest for all three measures. 7.5 Poverty Profiles for Indonesia and Cambodia
Indonesia • In forming the poverty profile, households have been grouped by their stated “principal income sources”. In principle one could form sub-groups according to the various interactions of primary and secondary income sources however, this would rapidly generate an unwieldy poverty profile. An alternative is to calculate average incomes from various sources for various consumption groups (such as ultra-poor, poor, near-poor, etc.). 7.5 Poverty Profiles for Indonesia and Cambodia
Indonesia • Changes in the poverty profile may arise from the contributions of different sub-groups in the poverty profile to changes over time in aggregate poverty. 7.5 Poverty Profiles for Indonesia and Cambodia
Table 7.6 Sectoral Decomposition of the Change in Poverty in Indonesia, 1984-1987
Table 7.7 Comparisons of Poverty Estimates from Cambodian Surveys Note: No sampling errors (reported in parentheses for the other years) are reported by the two previous poverty profiles but the relative errors for SESC 1993/94 and the adjusted 1997 CSES would likely be higher than the relative error in 1999 because the sampling scheme used previously was not as efficient (fewer clusters and broader stratification). The poverty line used for the unadjusted 1997 CSES results takes values of 1923 Riel per person per day in Phnom Penh, 1398 in other urban and 1195 in rural.
Table 7.8 Distribution of Poverty by Age and Gender of Household Head Source: Gibson(1999).
Cambodia • In addition to the gender of the HH head, marital status and widowhood is sometimes used as a sub-population characteristic for forming poverty profiles. • Two reasons why widow-headed households and households where there has been a dissolution could be at greater risk of poverty: • Loss of an economically active household member is likely to cause a large income shock that could push a household into poverty; 7.5 Poverty Profiles for Indonesia and Cambodia
Cambodia • The second factor, and the one that links marital status with household size, is that widow-headed households tend to be smaller than average, which will constrain the effective living standards of their residents if there are economies of household size. 7.5 Poverty Profiles for Indonesia and Cambodia
60 Headcount index 50 Share of total 40 Percentage 30 20 10 0 1 2 3 4 5 6 7 8 9 10+ Household Size Figure 7.2 Poverty by household size
Cambodia • Previous poverty profiles showed that poverty rates were relatively high among those whose household head either has no schooling or has only primary schooling. • Poverty rates fall with the attainment of lower secondary education, fall farther with upper secondary and are almost zero if the household head is a university graduate. However, those whose household head had a technical/vocational or other form of education had a higher poverty rate than those with primary schooling (at least in the 1997 poverty profile). 7.5 Poverty Profiles for Indonesia and Cambodia
60 Headcount index (+/- 2 std errors) Share of total 50 40 30 20 10 0 None Primary Lower Upper Technical/ University Other secondary secondary vocational Figure 7.3 Poverty by education level of household head
Table 7.9 Cambodia: Distribution of Poverty by Education Level of Head
Table 7.10 Distribution of Poverty by Employment Status of Head
In this box we report on a poverty mapping of Ecuador – how it was done, and what results emerged. The discussion rests heavily on Hentschel et al. (2000).[1] Ecuador has about 400 cantons and over 1,000 parishes (parroquias). The purpose of the exercise was to get poverty rates for each parish in the country. In principle this would allow a relatively finely-tuned targeting of the poorer parts of the country. Box: Poverty Mapping In Ecuador [1] Jesko Hentschel, Jean Olson Lanjouw, Peter Lanjouw and Javier Poggi, “Combining Census and Survey Data to Trade the Spatial Dimensions of Poverty: A Case Study of Ecuador,” The World Bank Economic Review, 14(1): 147-166.
The 1994 Encuesta sobre las Condiciones de Vida (a living standards measurement survey) obtained 4,391 usable responses from households, which was clearly inadequate for measuring poverty at the level of each parish or even canton. However the 1990 census counted about 2 million households, and collected information on a range of demographic variables such as household size, age, education, occupation, housing quality, language and location Box: Poverty Mapping In Ecuador
The research team used the data from the Encuesta to estimate regressions of the form Ln yi = X’i + i for each region of the country. The dependent variable was income per capita, and the independent variables were comparable to ones that were also available from the census. With R2 values of about 0.5, the fits were adequate. Then data from the census for each household were used in the equation in order to predict income for each household, and poverty rates computed for each parish. Box: Poverty Mapping In Ecuador
The main finding what that while the poverty rates for each of the broad regions are robust; the same is not true of the poverty rates by parish, where the standard errors of the estimates are relatively high. In an important test of the robustness of poverty mapping, the authors re-estimated the income equation using part of the Encuesta sample, predicted income for all households that were not included in the estimation (the validation sample), and then compared the predicted income with actual income. These out-of-sample predictions proved to be quite close to the actual values. Box: Poverty Mapping In Ecuador
In another test, Hentschel at al. simulated the effect of providing subsidies to the poorest parishes, and then asked what proportion of these benefits went to each income quintile. The results are reproduced here, and show that 77% of the subsidies would have gone to households in the lowest two quintiles – a respectably high level of successful targeting. Box: Poverty Mapping In Ecuador
Their conclusion? “The most useful practical application of this methodology is probably in making comparisons with regional patterns of other indicators of well-being, opportunity, and access” (Hentschel et al., p.162). Thus, for instance, one could map health indicators against estimated income at the regional level, and find a close and useful link. Box: Poverty Mapping In Ecuador