Download
1 / 28
280 likes | 425 Views
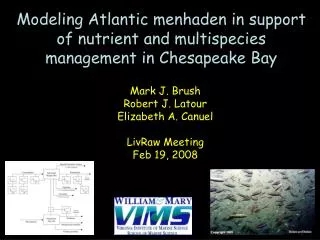
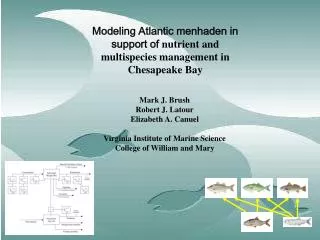
Modeling Atlantic menhaden in support of nutrient and multispecies management in Chesapeake Bay. Mark J. Brush Robert J. Latour Elizabeth A. Canuel Virginia Institute of Marine Science College of William and Mary. Chesapeake 2000 calls for ….

E N D
Modeling Atlantic menhaden in support of nutrient and multispecies management in Chesapeake Bay Mark J. Brush Robert J. Latour Elizabeth A. Canuel Virginia Institute of Marine Science College of William and Mary
Chesapeake 2000 calls for … • Assessment of the potential impacts of filter feeders on bay water quality. • Continued nutrient loading reductions • A move towards multispecies, ecosystem-based management * These issues are linked by the transfer of nutrient-fueled primary production up the food chain via filter feeders such as Atlantic menhaden …
Piscivores Other forage spp. Bottom-up effects Top-down effects Atlantic menhaden Plankton Nutrients
Menhaden-based food web: FISHING striped bass bluefish weakfish bay anchovy Atlantic menhaden • Approaches: • Ecopath with Ecosim • Bioenergetics PHYTOPLANKTON ZOOPLANKTON
Types of Multispecies Models • Multispecies Production • Models (MSP) Latour, Brush & Bonzek (2003) Toward ecosystem-based fisheries management: strategies for multispecies modeling and associated data requirements. Fisheries28(9):10-22 • Multispecies Virtual • Population Analysis • (MSVPA) • Ecopath with Ecosim (EwE) • Multispecies Bioenergetics • Models (MSBE)
Ecopath • Master equations translate to: Biomass of predator j Food consumed per unit biomass of predator j Biomass of i Total mortality Ecotrophic efficiency Net migration Biomass accum Fraction of i in diet of j Yield • Parameterization of an Ecopath model is based on satisfying two ‘master’ equations: 1) Production = catch + predation + net migration + biomass accumulation + other mortality 2) Consumption = production + respiration + unassimilated food
Why bioenergetics? Types of Multispecies Models Source: Latour et al. (2003)
Example: Atlantic menhaden GROWTH OR LOSS C C R TEMPERATURE FOOD TEMPERATURE Bioenergetics Approach … piecing together environmental data and biological relationships OUTPUTS respiration (R) feces (F) excretion (U) specific dynamic action (S) INPUTS consumption (C) Growth = C – R – F – U – S
R = Rmax * f(T) * ACT Rmax = aWb C = Cmax * f(T) * p Cmax = aWb MULTISPECIES BIOENERGETICS MODELS (MSBE) Specific Dynamic Action C * SDA coefficient Consumption Respiration Individual Weight (W) activity multiplier C C C R R T F W W T Egestion T T F C * (1-assimilation efficiency) day day day Excretion C * fraction excreted P B predator abundance Menhaden: Rippetoe (1993) Gottlieb (1998) Luo et al. (2001) Bay anchovy: Luo & Brandt (1993) Piscivores: Hartman & Brandt (1995) B Predation Population Size (N) Recruitment Background mortality Fishing mortality
Predatory Fish Nutrients ? Forage Fish Fish Larvae Sea Nettles Climate ? Comb Jellies Fishing ? Systems-level process models Microbial Loop Why bioenergetics? Estuarine Food Web Cloern, J.E. 2001. “Our evolving conceptual model of the coastal eutrophication problem” Mar Ecol Prog Ser 210:223-253 Micro- Zooplankton Meso- Zooplankton Small Phytoplankton Large Phytoplankton
Individual models for: Population models for: Menhaden Juveniles Menhaden J uveniles A ge - 0 Adults Age - 1 Age - 2 Menhaden Adults Age - 3 Age - 4 Bay anchovy Juveniles Age - 0 Bay anchovy Adults Age - 1 Groups in EwE model: Striped Bass Juveniles Striped Bass Juveniles Age - 0 Residents Age - 1 Age - 2 Striped Bass Residents Age - 3 Age - 4 Striped Bass Migrants Migrants Age - 5 Weakfish Juveniles Weakfish Juveniles Age - 0 Adults Age - 1 Weakfish Adults Age - 2 Bluefish Juveniles Bluefish Juveniles Age - 0 Adults Age - 1 Bluefish Adults Age - 2 MULTISPECIES BIOENERGETICS MODELS (MSBE)
Age-0 Menhaden Age-2 Menhaden model average trajectory min & max trajectories Starting point: Individual Bioenergetics Models for each Species & Age-Class
Fishing Mortality (limited to season) Non-predation, natural mortality Average rates for each species/group Population-level biomass models Prey loss Predator consumption Diet composition or foraging model Modified by co-occurrence MULTISPECIES BIOENERGETICS MODELS (MSBE) Age-specific individual models
Model calibration – Ecosim • Menhaden QR = 3.50 • In Ecosim, this • density-dependent effect is modeled as: Ft =QREt/[1+(QR-1)Bt/Bo] where QR=qmax/qo is the specified catchability increase ratio Bt = stock biomass at time t Bo = Ecopath base biomass
Current CBP study Some Key Limitations • Need Bay-specific stock assessments for: • - abundance • - biomass • - fishing mortality (F) • Need to refine menhaden feeding ecology
Objective 1: Menhaden Stock Assessment • R. Latour in collaboration with S. Martell and • NMFS Beaufort Lab • MDDNR and VIMS seine survey data (juveniles) • Fisheries-independent trawl data (adults) • Bay-specific landings • Simple biomass-based (e.g. surplus production) models • More complex age-structured models (e.g. VPA, • catch-at-age, etc.) • As much spatial and seasonal resolution as possible Timing: Year 1, with updates in Years 2-3
Objective 1: Menhaden Stock Assessment • Goals: • Age Resolution – • by year class • Temporal Resolution: • Annual • Seasonal • Monthly (?) • Spatial Resolution: • Baywide • Spatial elements • Output: Abundance, • biomass, & • F
Objective 2: Feeding & Diet Study • Stable isotopes in field-caught fish and prey sources: • - size-fractionated plankton, SAV & Spartina detritus • - long-term, integrated diet composition • Expt 1: Diet selectivity • Expt 2: Functional response (consumption vs. food conc.) • Expt 3: Density dependence (consumption vs. fish density) • Expt 4: Excretion rate Timing: Years 1-2
Menhaden Feeding Experiments 1. Starvation period (48 hours, 1 m filtered water) 2. Sample 3 fish stomachs to confirm guts are empty 3. Early A.M. - Fill tanks (n=20) with raw seawater from pier - Collect samples for size-fractionated Chl-a & CHN, TSS (pre- and post-combustion), particle size distribution, size-fractionated isotopes, and lipids 4. Expt start: place fish in tanks (1 per tank) ? Decide on expt duration & mid-point sampling 5. Expt end: collect samples from each tank for … - Size-fractionated Chl-a & CHN, TSS (pre- and post-combustion), particle size distribution • - Stomach contents • microscopic ID • - stable isotopes • lipid biomarkers
This project 2002 CBP Suspension Feeder Workshop … called for a multi-faceted approach to estimating the effects of suspension feeders on water quality … • Research and monitoring • Basic consumption estimates • Management-relevant intermediate • complexity models • Application of the 3-D water quality • model
ug/L 2 30 Objective 3: Basic Consumption Estimates • Individual daily rations (literature – seasonal variations) • Stock assessment (annual, seasonal, and regional abundance) • Planktonic food supply (Brush et al., C. Buchanan) Timing: Year 1
Objective 3: Basic Consumption Estimates • Goals: • Age Resolution – • by year class • Temporal Resolution: • Annual • Seasonal • Monthly (?) • Spatial Resolution: • Baywide • Spatial elements
Objective 4: Multi-Layered MSBE & EwE Modeling • Refine with stock assessment and experimental results • Force plankton concentrations • Daily, seasonal, & annual consumption, N cycling, and N export Timing: Years 1-2
Objective 4: Multi-Layered MSBE & EwE Modeling • Add dynamic feedbacks with plankton populations • Effect of menhaden cons. & excr. on plankton biomass & productivity • Fraction of menhaden yield supported by Bay production • Run over range of menhaden biomass & nutrient loading Timing: Years 1-2
Objective 4: Multi-Layered MSBE & EwE Modeling • Coupling to piscivores; full MSBE development • Role of menhaden as a forage base • Effect of fisheries management scenarios Timing: Years 1-2
Objective 4: Multi-Layered MSBE & EwE Modeling • Full coupling • Simultaneous impact of multiple stressors • (a la Cloern 2001) • Indirect effects • Comparison of nutrient and fisheries mgmt effects on menhaden yield & control of water quality Timing: Years 2-3
Objective 5: Comparison of Menhaden, Zooplankton, Oyster, and Clam Filtration • Add zooplankton, oyster, and clam information to MSBE and EwE models • Run for different regions of the Bay Timing: Year 3