Download
1 / 21
210 likes | 288 Views
Learn about the influence of union goals on compensation, working conditions, and labor practices, affecting the economy and employer-employee relations. Explore the effects of the union tax on industry dynamics and profitability.

E N D
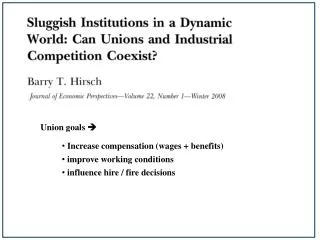
Union goals • Increase compensation (wages + benefits) • improve working conditions • influence hire / fire decisions
Defined and prohibited unfair employer labor practices Swings the balance back by defining and prohibiting some union tactics (Closed Shop) Taft Hartley Act Structural change in the economy (e.g., decline in manufacturing) accounts for roughly 15% of the decline. Other factors such as changes in the legal environment explain little of the decline. National Labor Relations Act (NLRA) Peaks at 36% In 1953-54 Great Depression & New Deal Policies
Union Tax in an Increasingly Competitive Environment Union Tax = Wage Premium + Productivity Losses – Productivity Gains Rigid Work Rules Job Bank / Rubber Room 2007 master contract (UAW & Ford) • 2,215 pages • 22 pounds • Height = 2 x Coke Can
Occupational Licensing imposes Work Rules on Firms: Teeth Whitening
Union Tax in an Increasingly Competitive Environment Union Tax = Wage Premium + Productivity Losses – Productivity Gains Worker’s “Voice” – public good • Non-excludable • Non-rival “Dr Clay Hallberg was the company doctor at Iowa Ham when it was bought by Gillette in 1992. Within a year, he’d called the plant manager, an old friend who’d worked with Clay’s cousin years before at a Hy-Vee grocery store in Cedar Rapids. Clay told the manager that he’d noticed an unsettling decline in the morale of the workers coming to see him since they’d lost their benefits. Clay was worried about the increase in drug use as well; more and more workers, suffering from depression now that they’d lost two thirds of their income overnight, were turning to meth. The plant manager said he’d look into it. A week later, Clay was fired.” (Methland, p. 53)
Construction Manufacturing
Union Tax = Wage Premium + Productivity Losses – Productivity Gains Economist Barry Hirsch assessment of the evidence is that “unions have, at most, small positive (but variable) effects on productivity insufficient to offset the substantial compensation gains.” Union Tax > 0 and in some cases >> 0
The effect of the union tax on profits depends on the proportion of firms within the industry that are unionized. For example, nearly every car sold in the United States in 1962 was produced by General Motors, Ford or Chrysler, all of which were unionized. By 2008, the market share of the Big-3 had decreased to less than 50 percent and most of the other companies were not unionized. Market Share of U.S. Vehicles, 1961-2010. US-Made (Big Three+) 1962: 95% market share 2008: 47% market share
Incidence of the Union Tax 2008 2008: 47% market share
Since there were virtually no substitutes to union-made cars in 1962, the demand for them was inelastic, which allowed the Big-3 to pass most of the union tax onto consumers in the form of higher prices. By 2008, the greater availability of substitutes increased the elasticity of the demand for union-made cars. Facing a more elastic demand curve for their cars reduced the ability of the Big-3 to pass the union tax onto consumers and, as a result, reduced their profitability and helped push General Motors and Chrysler into bankruptcy. In 1962, suppose measured in thousands of dollars Demand: measured in millions of cars per year No-Tax Supply: Tax: t = 5 thousand per car
Figure 1. Incidence of Union Tax when Market Share Price of Cars (thou of $) Quantity of Cars (Millions per year)
Figure 1. Incidence of Union Tax when Market Share Price of Cars (thou of $) The union tax causes the supply curve to shift vertically by $5 thousand Quantity of Cars (Millions per year)
Figure 1. Incidence of Union Tax when Market Share Price of Cars (thou of $) Consumer Burden The union tax causes the supply curve to shift vertically by $5 thousand Producer Burden Deadweight Loss Quantity of Cars (Millions per year)
In 2008, suppose measured in thousands of dollars Demand: measured in millions of cars per year No-Tax Supply: Tax: t = 5 thousand per car
Figure 2. Incidence of Union Tax when Market Share Price of Cars (thou of $) Consumer Burden Producer Burden Deadweight Loss Quantity of Cars (Millions per year)
“Unionization is associated with lower investment in physical and intangible capital and slower growth.” Surprising: higher cost of labor higher return to labor saving capital Possible Explanations: • lower profits less internal investment funds • immobile capital union will increase the tax “Although [management] and unions have different views as to how a firm’s revenues are to be divided, they have a mutual interest in maintaining employer’s financial health.”