Process Analysis
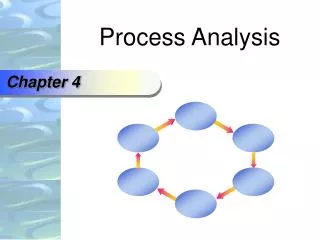
Process Analysis. Chapter 4. Define scope 2. Document process 3. Implement changes 6. Evaluate performance 4. Redesign process 5. A Systematic Approach to Process Analysis. Identify opportunity 1. Figure 4.2. A Systematic Approach to Process Analysis. Identify opportunities

Process Analysis
E N D
Presentation Transcript
Process Analysis Chapter 4
Define scope 2 Document process 3 Implement changes 6 Evaluate performance 4 Redesign process 5 A Systematic Approach to Process Analysis Identify opportunity 1 Figure 4.2
A Systematic Approach to Process Analysis • Identify opportunities • Give particular attention to four core processes • Supplier relationships • New service/product development • Order fulfillment • Customer relationship • Look at strategic issues • Encourage employees who perform the process or who are internal or external customers of the process to bring forward ideas • Define scope • Establish the boundaries of the process to be analyzed • Assign resources that match the scope of the process • Design teams may be established for large reengineering projects
A Systematic Approach to Process Analysis 3. Documenting the Process Flowcharts • Diagrams that trace the flow of information, customers, equipment, or materials through the various steps of a process. • Flowcharts show how organizations produce their outputs through a myriad of crossfunctional work processes, allowing the design team to see all the critical interfaces between functions and departments. Service blueprints • A special flowchart of a service process that shows which of its steps has high customer contact. • Special feature: line of visibility that identifies which steps are visible to the customer. • Service blueprints should show the extent and type of customer contact. Process Charts • Concentrates in more detail on a smaller number of steps that does a flowchart. • It is an organized way of documenting all of the activities performed with a customer by an employee, a machine, at a workstation, or on materials. • Five categories: • Operation, Transportation, Inspection, Delay, Storage
Flowchart of the Sales Process for a Consulting Company Figure 4.3
Flowchart of the Process Showing Handoffs Between Departments Figure 4.5
Service visible to customer Repair authorized Parts available Discuss needed work with customer* Customer drops off car Mechanic makes diagnosis* Check parts availability† Perform work† Parts not available Inspect/ test and repair Order parts Repair not authorized Corrective work necessary Repair complete Customer departs with car Perform corrected work Collect payment Notify customer Flow Diagrams Service not visible to customer * = Points critical to the success of the service Figure 4.6 † = Points at which failure is most often experienced
Service Blueprint of Consulting Company’s Inventory Appraisal Process Figure 4.7
Operation 5 23 — Transport 9 11 815 Inspect 2 8 — Delay 3 8 — Store — — — Process Charts Summary Process: Emergency room admission Subject: Ankle injury patient Beginning: Enter emergency room Ending: Leave hospital Number Time Distance Activity of steps (min) (ft) Insert Step Append Step Remove Step Step Time Distance Step description no. (min) (ft) 0.50 15 10.0 - 0.75 40 3.00 - 0.75 40 1.00 - 1.00 60 4.00 - 5.00 - 2.00 200 3.00 - 2.00 200 3.00 - 2.00 - 1.00 60 4.00 - 2.00 180 4.00 - 1.00 20 1 X Enter emergency room, approach patient window 2 X Sit down and fill out patient history 3 X Nurse escorts patient to ER triage room 4 X Nurse inspects injury 5 X Return to waiting room 6 X Wait for available bed 7 X Go to ER bed 8 X Wait for doctor 9 X Doctor inspects injury and questions patient 10 X Nurse takes patient to radiology 11 X Technician x-rays patient 12 X Return to bed in ER 13 X Wait for doctor to return 14 X Doctor provides diagnosis and advice 15 X Return to emergency entrance area 16 X Check out 17 X Walk to pharmacy 18 X Pick up prescription 19 X Leave the building Figure 4.8
A Systematic Approach to Process Analysis 4. Evaluate performance • Identify metrics: performance measures that are established for the process and the steps within it • Create multiple measures of: • Quality • Customer satisfaction • Throughput time • Cost • Errors • Safety • Other key competitive priorities
Wellington Fiber Board Co. Tools for Improving Quality • Step 1—Checklist • Step 2—Pareto chart • Step 3—Cause-and-effect diagram • Step 4—Bar chart
Headliner Defects Defect type Tally Total A. Tears in fabric //// 4 B. Discolored fabric /// 3 C. Broken fiber board //// //// //// //// //// //// //// / 36 D. Ragged edges //// // 7 Total 50 Wellington Fiber Board Co. Checklists Figure 4.12
50 40 30 20 10 0 100 80 60 40 20 0 C Cumulative percentage Number of defects D A B Defect type Wellington Fiber Board Co. Pareto Chart Figure 4.12
People Materials Training Absenteeism Communication Out of specification Not available Broken fiber board Machine maintenance Machine speed Wrong setup Humidity Schedule changes Other Process Wellington Fiber Board Co. Cause-and-Effect Diagram Figure 4.12
20 15 10 5 0 Number of broken fiber boards First Second Third Shift Wellington Fiber Board Co. Bar Chart Figure 4.12
Simulation Figure 4.15(a)
A Systematic Approach to Process Analysis • Redesign process • Uncover disconnects or gaps between actual and desired performance • Find root causes of performance gaps • Design and document new process Ask six questions about each step in the process: What is being done? When is it being done? Who is doing it? Where is it being done? How is it being done? How well does it do on the various metrics of performance? For each question, ask why? • Creativity can be stimulated by having a brainstorming session • Benchmarking • Planning: identify process, leader, performance measures • Analysis: measure gap, identify causes • Integration: establish goals and resource commitments • Action: develop teams, implement plan, monitor progress, return to step 1 • Implement changes • Widespread participation in analysis is essential, for commitment and expertise • View and manage implementation as a project
Seven mistakes to avoid in managing processes • Not connecting with strategic issues • Not involving the right people in the right way • Not giving the design teams and process analysts a clear charter, and then holding them accountable • Not satisfied unless fundamental “reengineering” changes are made • Not considering the impact on people • Not giving attention to implementation • Not creating an infrastructure for continuous improvement
Process Capacity Chapter 6
Define scope 2 Document process 3 Redesign Process (Capacity change) 5 Implement changes 6 Evaluate performance 4 Redesigning a Process Through Capacity Change Identify opportunity 1 Figure 6.1
Average output rate Maximum capacity Utilization = x 100% Utilization
To customers Inputs 1 2 3 200/hr 200/hr 50/hr Capacity Bottlenecks (a) Operation 2 a bottleneck Figure 6.2
To customers Inputs 1 2 3 200/hr 200/hr 200/hr Capacity Bottlenecks (b) All operations bottlenecks Figure 6.2
Theory of Constraints Identify the system bottleneck(s) Exploit the bottleneck(s) Subordinate all other decisions to Step 2 Elevate the bottleneck(s) Do not let inertia set in
250-bed hospital 750-bed hospital 500-bed hospital Average unit cost (dollars per patient) Economies of scale Diseconomies of scale Output rate (patients per week) Economies and Diseconomies of Scale Figure 6.3
Capacity Cushions Capacity Cushion = 100% - Utilization Rate (%) • Utilization rates tend to be higher in capital-intensive industries. • Large cushions are particularly vital for front-office processes where customers expect fast delivery times • Factors Leading to Large Capacity Cushions • When demand is variable, uncertain, or product mix changes • When finished goods inventory cannot be stored • When customer service is important • When capacity comes in large increments • When supply of material or human resources is uncertain • Factors leading to small capacity cushions • Unused capacity costs money. • Large cushions hide inefficiencies, absenteeism, and unreliable material supply. • When subcontractors are available to handle demand peaks
Forecast of capacity required Planned unused capacity Capacity increment Capacity Time between increments Time Capacity Strategies (a) Expansionist strategy Figure 6.4
Forecast of capacity required Planned use of short-term options Capacity increment Capacity Time between increments Time Capacity Strategies (b) Wait-and-see strategy Figure 6.4
Linking Process Capacity and Other Decisions • Competitive Priorities • Quality • Process Design • Aggregate Planning
A Systematic Approach to Capacity Decisions • Step 1: Estimate capacity requirements • Begin with a forecast of demand, productivity, competition, and technological change for several periods in a time horizon. • Long-range forecast errors will be large. • Capacity may be defined in terms of outputs or inputs. • Step 2: Identify gaps • Use the correct capacity measure. The correct measure is determined by what is critical to the bottleneck operation. • Step 3: Develop alternatives • Base case … do nothing • Alternative timing and size of capacity additions/closings • Expansionist strategy • Wait-and-see strategy • Expand at a different location • Use short-term options … overtime, temporary workers, subcontracting • Step 4: Evaluate the Alternatives • Qualitative concerns • Fit with overall capacity strategy • Uncertainties in demand, competitive reaction, technological change, and cost • Quantitative concerns • Net present value of after-tax cash flows
Tools for Capacity Planning Waiting line models • Reasons waiting lines (or queues) form • Variable times between successive jobs or customer arrivals • Variable processing or service times • Relate to Supplement C for problems. Simulation • Useful for more complex waiting-line problems • Can identify process bottlenecks and capacity cushions for complex processes with random demand patterns with predictable surges in daily demand • Relate to Supplement B for problems. Decision trees • Can be applied to a wide range of decisions • Valuable for capacity decisions when demand is uncertain and when sequential decisions are involved • Relate to Supplement A for problems.
Waiting Lines Supplement C
Customer population Service system Waiting line Served customers Service facilities Priority rule Figure C.1 Waiting Line Models
Service facilities (a) Single line Service facilities (b) Multiple lines Waiting Line Arrangements Figure C.2
Service facility Service Facility Arrangements (a) Single channel, single phase Figure C.3
Service facility 1 Service facility 2 Service Facility Arrangements (b) Single channel, multiple phase Figure C.3
Service facility 1 Service facility 2 Service Facility Arrangements (c) Multiple channel, single phase Figure C.3
Service facility 1 Service facility 3 Service facility 2 Service facility 4 Service Facility Arrangements (d) Multiple channel, multiple phase Figure C.3
Service facility 1 Service facility 2 Service facility 3 Service facility 4 Routing for : 1–2–4 Routing for : 2–4–3 Routing for : 3–2–1–4 Service Facility Arrangements (e) Mixed Figure C.3
Operating Characteristics • Line Length • Number ofCustomers in System • Waiting Time in Line • Total Time in System • Service Facility Utilization
Supplement C: Waiting Line Models Single-Server Model TM E.1a
Supplement C: Waiting Line Models Multiple-Server Model TM E.3a
Supplement C: Waiting Line Models Single-Server Model TM E.4a
Decision Areas • Arrival Rates • Number of Service Facilities • Number of Phases • Number of Servers Per Facility • Server Efficiency • Priority Rule • Line Arrangement
D D L L M M D D L L M M L L M M G G L L G G A A A A G G Process Layout Chapter 7
Define scope 2 Document process 3 Redesign Process (Revise layout) 5 Implement changes 6 Evaluate performance 4 Redesigning a Process Through Layout Revision Identify opportunity 1 Figure 7.1
Strategic Issues • Facilitating the flow of materials • Increasing the efficient utilization of labor and equipment • Reducing hazards to workers • Improving employee morale • Improving communication
Grinding Forging Lathes Painting Welding Drills Milling Office Foundry machines Layout Types (a) Layout of a job shop Figure 7.3
Station 1 Station 2 Station 3 Station 4 Layout Types (b) Layout of a production line Figure 7.3
Machine 2 Machine 3 Machine 1 Materials in Finished goods out Machine 4 Machine 5 One Worker, Multiple Machines Group Technology Figure 7.4