Download
1 / 30
300 likes | 482 Views
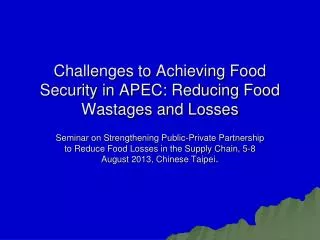
APEC Seminar on “Strengthening Public-Private Partnership to Reduce Food Losses in the Supply Chain” 5-8 August, 2013, Taipei. The Methodology of APEC Food Losses Assessment. Emily Ching -Cheng CHANG Research Fellow Institute of Economics, Academia Sinica. Outline. Backgrounds

E N D
APEC Seminar on “Strengthening Public-Private Partnership to Reduce Food Losses in the Supply Chain” 5-8 August, 2013, Taipei The Methodology of APEC Food Losses Assessment Emily Ching-Cheng CHANG Research Fellow Institute of Economics, Academia Sinica
Outline • Backgrounds • Connection between FS and Food lose/waste • Current Status • By products/supply chain/level of development • Methodology for APEC • Preliminary Results
Background PHL reduction matters because its absence will • Reduce availability of food • Reduce quality, safety, nutritional values • Raise costs of production and distribution • Lower sectoralvalue-added
As food prices continued to rise, the stakes got higher So has the opportunity cost of post-harvest losses Recent Trend of Food Price Index Source: FAO,World Food Situation: FAO Food Price Index
High incidence of PHL toward food insecurity Globally speaking, food losses and waste: • 1.3 billion ton/yr • Over 1/3 – 1/2 of production • Over USD 450 billion/yr – By 2020, estimated to increase by 40%
PHL by region(kg/ per person per year) • Food Losses • Europe and N America (180-190 kg) • Industrialized Asia (160 kg) • Southeast Asia (110-160 kg) • Food Wastage • Europe and N America (80-100 kg) • Industrialized Asia (80 kg) • Southeast Asia (5-10 kg)
Connection between PHL and Food Security/Safety SOURCE: Opara, L. “Novel Postharvest Technologies for Food Security and Safety.” http://www.globalsciencecollaboration.org/public/site/PDFS/food/Opara%20L.%20Novel%20Postharvest%20Technologies%20for%20Food%20Security%20and%20Safety.pdf
Research Needed • Quantify extent and economic cost of PHL in APEC region • Calculate how much reduction of PHL would be required to end hunger in APEC region • Determine whether reducing PHL would enable food security in APEC region
Extent of Food Losses and Waste • By stages of supply chain • By member economies • By products
By Product & Stage Source: Gustavsson et al .(2011), Global Food Losses and Food Waste: Extent Causes and Prevention, FAO, Rome.
Methodology • Commodity System Analysis (CSA) • CSA is widely use on postharvest handling and marketing of a given commodity. • CSA is made up of27 components that together account for all the steps associated with the production • Mass Flow Model (MFM) • MFM is developed by the Swedish Institute for Food and Biotechnology (SIK) • Using available food balance sheet data • Aimed to human consumption • Quantify physical mass throughout the supply chain using SIK own assumptions
Commodity System Analysis (CSA) • 26 components • Each component is potentially important • But not always relevant for all commodities • Permits analysis of a whole commodity systems • Requires a multidisciplinary team • Data collection is costly Source: La Gra et al.1990
Problem of CSA • Losses for developing country records do not exist • Do not cover a long enough period of time • Assessment are only estimated by several observers • Records may not truly represent a continuing situation, for example : • losses may have been calculated only when unusually high or low • loss figures may be deliberately over- or understated in order to gain benefits or to avoid embarrassment
Mass Flow Model (MFM) Source: Linpinski et al .(2013) Creating a Sustainable Food Future, Installment Two: Reducing Food Loss and Waste
FAO Food Balance Sheet Mass Flow
Allocation Ratio - To determines the part of food that is allocated for human consumption. Food (Fresh) (L) Allocation Ratio Food (K) Food (Processed) (M) (1-Allocation Ratio)
Formulae for Food Losses and Waste Calculation LW1=A* (❶/ (1+❶)) Production Handling & Storage LW2=A*❷ LW3=(L+H)*❸ Processing & Packaging LW4=K*❹ Lw5= (L+H-LW3)*❺ Distribution & Market LW6=(K-LW4)*❻ LW7=(L+H-LW3-LW5)*❼ Consumption Losses & Waste along Supply Chain
Loss Ratios along the Food Supply Chain Source: Gustavsson et al .(2011), Global Food Losses and Food Waste: Extent Causes and Prevention, ANNEX 4, FAO, Rome.
Preliminary Results-1 • Per capita loss by weight (Kg) • Wheat: 1~43 kg (15 kg avg per year) • Maize: 1~66 kg (11 kg avg per year) • Rice: 1~38 Kg (13 kg avg per year)
Preliminary Results-2 • Convert into per capita calorie losses (Kcal) using FAO Food Balance Sheet • Wheat: 4~367 (112 kcal avg per year) • Maize: 4~489 (80 kcal avgper year) • Rice: 8~381 (131 kcal avg per year)
Preliminary Results-3 • Convert into per capita monetary losses (USD) using FAO producer prices*1.5 • Wheat: 2~15 (6 USD avg per year) • Maize: 1~14 (3 USD avg per year) • Rice: 1~50 (l0 USD avg per year) 24 billion 14 billion 13 billion
APEC Information Platform on Post Harvest Loss and Waste System (PHLOWS) • Purpose • Support C food security policy formulation • Identify opportunities to improve value chains • Monitor and evaluate loss reduction activities Examined by Member Economy APIP Website
APIP-PHLOWS Webpage https://sites.google.com/site/apecharvestlost/
Cover Page Click