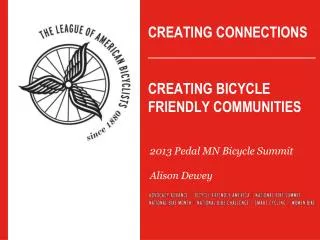
Cycling & Multi-use Trails: Economic Impacts
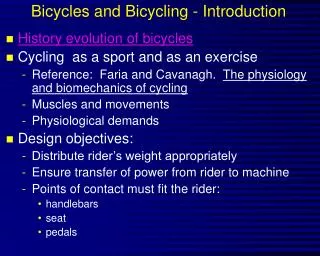
Cycling & Multi-use Trails: Economic Impacts. Martin Daley, Parks & Trails New York. March 11, 2011. ¾ of Americans participate in active outdoor recreation. Bicycling is the second most popular outdoor recreation activity in U.S. Bicycling is Popular. Outdoor Industry Association (OIA).

Cycling & Multi-use Trails: Economic Impacts
E N D
Presentation Transcript
Cycling & Multi-use Trails:Economic Impacts Martin Daley, Parks & Trails New York March 11, 2011
¾ of Americans participate in active outdoor recreation • Bicycling is the second most popular outdoor recreation activity in U.S. Bicycling is Popular Outdoor Industry Association (OIA)
Demographics • Higher income households • Educated professionals • Typically spend between $150 to $300/day
spending • Longer trails/routes – people will travel farther, stay longer and spend more • Day trippers spend 4X amount of locals • Overnight visitors spend 2X amount of day trippers • $255/person • X 10 days • X 10 cyclists • = $25,000
Single day tour – 75% willing to travel no more than 100 mi. • 2-3 day tour – 50% willing to travel up to 300 mi. • Week or more tour – 80% willing to travel over 300 mi. How far are they willing to travel?
When traveling alone or with friends – 40 miles or more • When traveling with families – under 40 miles How Many Miles a Day do they prefer?
Estimated annual impact of bicycle tourism in select states Source: Maine DOT, Universite du Quebec, Colorado DOT, Bike Federation of Wisconsin
Cycling in Maine • Bicycling an activity for 5% of overnight tourists • 2% of day trippers • Annual Economic Impact: $66 million, 1,200 jobs Maine DOT
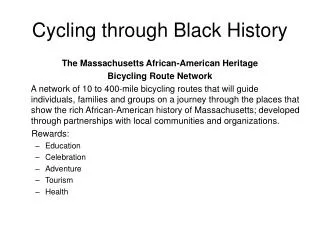
Business owners adjacent to Cape Cod Rail Trail • 24% = the trail played a part in decision to open business • 53% = revenue from trail users over 10% of business • 60% = trail a prominent factor in expansion Mass department of Environmental Management, 1993
York County Heritage Trail (PA) • 300,000 annual users • Avg. expenditure for soft goods (SG) = $13 per trip • Annual revenue from SG = $3 million • 10% of users stayed overnight. Average expenditure = $51 National Parks Service, 2007
Creeper Rail-Trail (VA) • Additional Employment = 27.4 • Total Value Added = $921,000 • Labor Income = $610,000 • Indirect Business Taxes = $104,000 • Annual Economic Impact = $1.6M National Forest Service, 2004
Ghost Town Trail (PA) • Hard goods (HG) purchased = 88.4% • Avg. HG expenditure = $357 • Annual SG revenue= $743,000 • Annual overnight revenue =$430,000 • Annual impact = $1.2M Rails to Trails, 2009
Annual Estimates for the Lake Placid to Tupper Lake trail(NY) • SG revenue = $676,700 • Transportation revenue = $199,400 • Overnight revenue = $353,000 • Economic impact = $1.23M • Jobs created = 13 Camoin Associates, 2010
2008 NYS Trails Study • Catharine Valley • Chautauqua Rails to Trail • Erie Canalway • Genesee Valley • Lehigh & Auburn • Mohawk Hike & Bike • North & South County Trail • O&W/D&H “EVERY MILE COUNTS” AN ANALYSIS OF SIX 2008 TRAIL USER SURVEYS, September 2010. NYSOPRHP
NYS Trails Study • Non-local users averaged $202.35 per visit • Economic impact of each trail estimated at $2 million “EVERY MILE COUNTS” AN ANALYSIS OF SIX 2008 TRAIL USER SURVEYS, September 2010. NYSOPRHP
What to take away • Most users purchase soft goods ($10 - $15 per visit) • Many users purchase hard goods to make trail use possible • 7-10% of users stay over ($30 - $55 per stay)
A major National Park Service study of 3 rail-trails - • Urban (California) • Suburban (Florida) • Rural (Iowa) • Finding showed trail use pumped $1.2M - $1.9M annually into local economies Economic Benefits Moore, Graefe, Gitelson, Porter. The Impact Of Rail-Trails: A study of the users and property owner from three trails.
Annual cost of inactivity shouldered by NYS taxpayers $9.9 BILLION Schoen, C., & Commonwealth Fund. (2007). Bending the curve: Options for achieving savings and improving value in U.S. health spending. New York, N.Y.: Commonwealth Fund.
Cost of physical inactivity in NY • 5% rise in physical activity rates would save NY at least $180 million per year • Inactive adults have more than $300 more per year in direct medical costs than active adults Bullet1: Chenoweth, “Physical Inactivity in NYS, An Economic Cost Analysis”, 1999 Bullet 2: Pratt, M. “Higher Direct Medical Costs Associated with Physical Inactivity”, The Physician and Sports Medicine, October, 2000.