External Analysis: Industry Structure, Competitive Forces, & Strategic Groups
740 likes | 1.27k Views
External Analysis: Industry Structure, Competitive Forces, & Strategic Groups. Part 1 Strategy Analysis. LO 3-1 Apply the PESTEL model to organize and assess the impact of external forces on the firm.

External Analysis: Industry Structure, Competitive Forces, & Strategic Groups
E N D
Presentation Transcript
External Analysis: Industry Structure,Competitive Forces, & Strategic Groups
LO 3-1Apply the PESTEL model to organize and assess the impact of external forces on the firm. LO 3-2 Apply the structure-conduct-performance (SCP) model to explain the effect of industry structure on firm profitability. LO 3-3Apply the five forces model to understand the profit potential of the firm’s industry. LO 3-4 Describe the strategic role of complements in creating positive-sum co-opetition. LO 3-5 Understand the role of industry dynamics and industry convergence in shaping the firm’s external environment. LO 3-6 Apply the strategic group model to reveal performance differences between clusters of firms in the same industry.
Build Your Dreams (BYD) to Sidestep Entry Barriers Chapter Case 3 • Changing U.S. car market • More competition from outside the U.S. • However, NO new entry firms in the last 2 decades • High barriers to entry • BYD led by founder, Wang Chuanfu in China is entering the car market • Batteries to cars…bypassing many hurdles • Electric cars have fewer parts • BYD has the battery technology • Selling in China, Africa, & South America Hybrid Car Video
BYD Electric Vehicles • What are their chances of success? • Warren Buffet invested for 10% equity. -- Sticker price half that of a Chevy Volt. -- Many obstacles are ahead • Which PESTEL factors will be most important for electric vehicles in the 21st century? • BYD was China’s fastest-growing carmaker • Sold more than 500,000 cars in 2010 • Shanghai government subsidy for EVs
PESTEL Framework • Political • Government pressures • Subsidies and incentives • Differences in countries, states, and regions • Economic • Growth rates • Interest rates • Employment levels • Currency exchange • Sociocultural • Norms, culture, values • Demographics • Lifestyle changes • Technological • Innovation • Diffusion • Research & development • Environmental • Global warming • Sustainability • Pollution • Legal • Court system • Legislation • Hiring laws
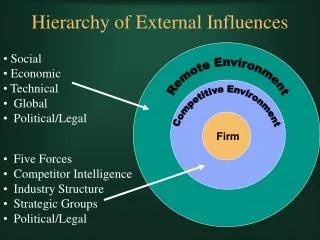
The Firm Embedded in Its External Environment EXHIBIT 3.1
UBS Relents to Pressure by U.S. Government STRATEGY HIGHLIGHT 3.1 • Large Swiss bank in trouble… • U.S. government accused UBS of aiding in tax evasion • Billions of dollars moved offshore • Names of 52,000 U.S. citizens sought • Eventually over 4,450 names were released • Imperils Swiss Bank secrecy • Historically, a competitive advantage
LO 3-1 Apply the PESTEL model to organize and assess the impact of external forces on the firm. LO 3-2Apply the structure-conduct-performance (SCP) model to explain the effect of industry structure on firm profitability. LO 3-3Apply the five forces model to understand the profit potential of the firm’s industry. LO 3-4 Describe the strategic role of complements in creating positive-sum co-opetition. LO 3-5 Understand the role of industry dynamics and industry convergence in shaping the firm’s external environment. LO 3-6 Apply the strategic group model to reveal performance differences between clusters of firms in the same industry.
Industry Structures along the Continuum EXHIBIT 3.2 Bank Oligopolies Video
Efficient Markets • The efficient market hypothesis, in financial markets, is one in which prices reflect information instantaneously and one in which extra-ordinary profit opportunities are thus rapidly dissipated by the action of profit-seeking individuals in the market. • How well does the efficient market hypothesis for capital markets apply to product markets? • If the efficient market hypothesis applied fully to product markets then we should see over time equalization in risk-adjusted rates of return across industries. • What do the data support?
Some Industries Are More Profitable Than Others ROE & ROA - Selected Industries, 1989 30% 25% 20% ROE 15% ROA 10% 5% 0% Pharmaceuticals Tires / Rubber Home Appliances
Within Industries, Some Competitors Perform Better than Others. ROE - Pharmaceutical Industry 1989 60% 50% 40% 30% 20% 10% 0% Amgen AMP Eli Lilly Merck Mylan Pfizer
Three Factors Determining Company Performance • Industry Context • e.g., during the last two decades, companies in the airlines industry have been persistently less profitable than those in the pharmaceutical industry • National Context • e.g., world’s most successful consumer electronics firms are in Japan • Company Capabilities and Strategies • e.g., Wal-mart and Southwest Airlines
LO 3-1 Apply the PESTEL model to organize and assess the impact of external forces on the firm. LO 3-2 Apply the structure-conduct-performance (SCP) model to explain the effect of industry structure on firm profitability. LO 3-3 Apply the five forces model to understand the profit potential of the firm’s industry. LO 3-4 Describe the strategic role of complements in creating positive-sum co-opetition. LO 3-5 Understand the role of industry dynamics and industry convergence in shaping the firm’s external environment. LO 3-6 Apply the strategic group model to reveal performance differences between clusters of firms in the same industry.
Competitive Forces and Firm Strategy • The Five Forces Model • The classic industry analysis model • Threat of Entry/Barriers to Entry • Note: High barriers to entry means threat of entry is low • Power of Suppliers • Power of Buyers • Threat of Substitutes • Rivalry Among Existing Competitors
Porter’s Five Forces Model EXHIBIT 3.3 5 forces video- M. Porter Source: Porter, M. E. (2008), “The five competitive forces that shape strategy,” Harvard Business Review
Barriers To Entry • The free entry and free exit assumption that works reasonably well for describing financial markets seems to be a premise that strays so far from our world of experience that the assumption impedes our understanding of real-world product competition. • Thus, empirical evidence suggests that (risk-adjusted) ROE does NOT equalize in the long run.
A Taxonomy of Barriers to Entry • (1)Economies of Scale • Product-specific economies of scale • Lower setup costs as a percentage of total costs • More specialized machinery and tooling (e.g., Honda) • Plant-specific economies of scale • Engineers’ 2/3 rule: Since the area of a sphere or cylinder varies as two-thirds power of volume, the cost of constructing process industry plants can be expected to rise as two thirds power of their output capacity. (This rule applies to petroleum refining, cement making, iron ore reduction and steel conversion). • Also “economies of massed reserves”
A Taxonomy of Barriers to Entry • Economies of Scale • Multi-product economies of scale (“economies of scope”) • Example: Cost (Iron, Steel) < Cost (Iron) + Cost (Steel) • Key idea: Shareable input (In this case, thermal economies in the production of iron and steel) • Modern examples: Aircraft, Automobiles, Consumer electronics, Household Appliances; Personal Computers, Software, Power Tools • Multi-plant economies of scale • Economies of multi-plant production, investment, and physical distribution.
Examples of Economies of Scope • Aircraft: Common wing, nose, and tail components allow several models to be leveraged using different numbers of fuselage modules to create aircraft of different lengths and passenger capacities by Boeing and Airbus Industries. • Automobiles:The Taurus platform was leveraged to provide the basis for Taurus sedans and minivans. • Consumer Electronics:Over 160 variations of the Sony Walkman were leveraged by “mixing and matching” modular components in a few basic system designs. (“Legos”)
A Taxonomy of Barriers to Entry • (2) Experience Curve Advantages • Marvin Lieberman, a management professor at UCLA, found that in the chemical industry, on average, each doubling of plant scale over time was accomplished by an 11% reduction in unit costs. Thus, there is an “89% learning curve.” • (Note: The mere presence of an experience curve does not insure an entry barrier. Another critical prerequisite is that the experience be kept proprietary, and not be made available to competitors and potential entrants.)
A Taxonomy of Barriers to Entry • (3) Intended Excess Capacity • Building extra capacity for the intended purpose of deterring entrants from entering the industry. (Note: potential free-rider problems) • Excess capacity deters entry by increasing the credibility of price cutting as an entry response by incumbents (ex: Dupont in the production of Titanium Dioxide for paint) • “Innocent” excess capacity: Demand is cyclical; Demand falls short of expectations; Demand is expected to grow.
A Taxonomy of Barriers to Entry • (4) Reputation • A history of incumbent firms reacting aggressively to entrants may play a role in current market interactions. • (5) Product Differentiation • Brand identification and customer loyalty to incumbent products may be a barrier to potential entrants (e.g., Coca-Cola). Product differentiation appears to be an important entry barrier in the market for over-the counter drugs and in the brewing industry.
A Taxonomy of Barriers to Entry • (6) Capital Requirements • (7) High Switching Costs of Buyers • E.g., changing may require employee retraining (e.g., IV solutions, and computer software).
A Taxonomy of Barriers To Entry (8) Access to Distribution Channels • The manufacturer of a new food product, for example, must persuade the retailer to give it space on the fiercely competitive supermarket shelf via promises of promotion, and intense selling efforts to retailers. (9) Favorable Access to Raw Materials and to Markets • Alcoa --> bauxite • Exclusive dealing arrangements • Favorable geographic locations
A Taxonomy of Barriers To Entry • (10) Proprietary Technology • Product know how • Low cost product design • Patents (and other government restrictions) • (11) Exit barriers (of incumbents) can be entry barriers (to potential entrants)
A Taxonomy of Barriers To Entry • High exit costs: • High exogenous and endogenous sunk costs (not just high fixed costs!) • High asset specificity • Highly illiquid assets • Low salvage value if exit occurs • High switching costs • Low mobility of assets • Credible commitments • Irreversible investment e.g., Alaskan pipeline built in 1977 at a cost of $10 billion
Power of Suppliers – HIGH IF: • Dominated by a few companies • No substitutes for supplier products • Suppliers products are differentiated • Incumbents face high switching costs • Product is important input to buyer • Forward Integration is a credible threat Suppliers exert power in the industry by: threatening to raise prices or to reduce quality. Powerful suppliers can squeeze industry profitability.
Power of Buyers – HIGH IF: Buyers compete with the supplying industry by: Bargaining down prices Forcing higher quality Playing firms off of each other • A few large buyers (potential collusion) • Large buyers relative to a seller (e.g., HMO power buying pharmaceuticals) • Products are standardized and undifferentiated • Buyers face few switching costs • High switching costs for sellers • Backward Integration is credible (buyer has full information)
Threat of Substitutes – HIGH IF: Products with similar functions limit the prices firms can charge • Substitute is good price-performance trade-off • Buyers switching costs to substitute is low
Incumbent Rivalry– HIGH IF: • Many competitors in the industry (industry concentration is low) • Firms are of equal size • Industry growth is slow or shrinking (over-capacity is high) • Exit barriers are high • Contractual obligations • Geographic or historical attachments • Products and services are direct substitutes (product differentiation is low)
Degree of Rivalry • Advertising battles, on the other hand, may well expand or enhance the level of product differentiation in the industry for the benefit of all firms. • In other words, advertising is not necessarily a “zero-sum” game.
The Uses of Industry Analysis • Static Analysis - • How do we explain current rivalry and profitability? • Dynamic Analysis - • Where is the industry Headed In likely to be in the future?
demand time Industries Evolve over Time as the Relationships Between the Five Forces Change • Dynamic 5-Forces Analysis
LO 3-1 Apply the PESTEL model to organize and assess the impact of external forces on the firm. LO 3-2 Apply the structure-conduct-performance (SCP) model to explain the effect of industry structure on firm profitability. LO 3-3Apply the five forces model to understand the profit potential of the firm’s industry. LO 3-4Describe the strategic role of complements in creating positive-sum co-opetition. LO 3-5Understand the role of industry dynamics and industry convergence in shaping the firm’s external environment. LO 3-6 Apply the strategic group model to reveal performance differences between clusters of firms in the same industry.
Substitutes and Complements • Substitute: An alternative from outside the given industry for its product or service. When its performance increases or its price falls, industry demand decreases. • Plastic vs. aluminium containers • Video conference vs. business travel • Complement: A product or service or competency that adds value to original product. When its performance increases or its price falls, industry demand increases. • Paper for Xerox copiers • iTunes for iPod music players • Complementor: If customers value your product more when combined with another firm’s product or service. • Michelin tires for Ford & GM
A Sixth Force -- Complementors • The biggest benefit of considering complementors is that they add a cooperative dimension to Porter’s (1980) “competitive forces” model. • “Thinking [about] complements is a different way of thinking about business. It’s about finding ways to make the pie bigger rather than fighting with competitors over a fixed pie. To benefit from this insight, think about how to expand the pie by developing new complements or making existing complements more affordable.” • Brandenburger & Nalebuff
Determining Industry Attractiveness EXHIBIT 3.5
LO 3-1 Apply the PESTEL model to organize and assess the impact of external forces on the firm. LO 3-2 Apply the structure-conduct-performance (SCP) model to explain the effect of industry structure on firm profitability. LO 3-3Apply the five forces model to understand the profit potential of the firm’s industry. LO 3-4 Describe the strategic role of complements in creating positive-sum co-opetition. LO 3-5 Understand the role of industry dynamics and industry convergence in shaping the firm’s external environment. LO 3-6Apply the strategic group model to reveal performance differences between clusters of firms in the same industry.
Strategic Groups • Mobility Barrier Dimensions To Consider: • Specialization • Width of product line • Target customer segments • Geographic markets served • Brand Identification • Advertising • Sales Force • Technological Leadership • First Mover vs. Imitation Strategy
Strategic Groups • Mobility Barrier Dimensions To Consider: • Product Quality • Raw materials • Specifications • Features • Durability • Cost Position • Economies of scale and scope • Vertical Integration • Backward and/or forward • Exclusive contracts and in-house service networks
Strategic Groups • Mapping Groups • Auto industry example • GM, Ford, Toyota – gas • BYD, Tesla – electric • ID best dimensions • Choose two for map • Locate firms on map • Bubble size = market share • Rivalry is strongest in the same group • Some groups are more profitable than others • Mobility Barriers • Firms would try to move to the profit spots BUT… • Specific factors that separate groups • Airlines • International routes • Regulations: airport slots
EXHIBIT 3.7 Strategic Groups and Mobility Barrier – U.S. Airlines