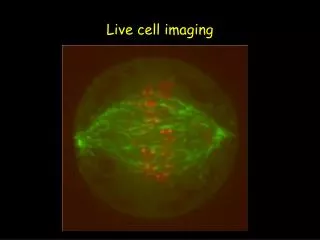
Live cell imaging
Live cell imaging. Why live cell imaging?. Live cell analysis provides direct spatial and temporal information Planning your experiment The markers/ fluorophores The cell’s environment Practical aspects of the experiment: the microscope Photodamage Applications of live cell imaging.

Live cell imaging
E N D
Presentation Transcript
Why live cell imaging? • Live cell analysis provides direct spatial and temporal information • Planning your experiment • The markers/fluorophores • The cell’s environment • Practical aspects of the experiment: the microscope • Photodamage • Applications of live cell imaging
Select your markers carefully You only see a limited number of molecules/fluorophores 2 to3 channels in live cell imaging
Fluorophores • Usually tag: GFP, mCherry, Venus, dTomato, etc… • Transient transfections • Overexpression • Inducible expression • Endogenous levels of plasmid at endogenous promoter
What you need to do • Keep the cells happy • Optimize your experiment to get the most out of it • Limit photodamage (cells will change their behavior)
Key components • Preparation and holding of the cell specimen • Temperature and CO2 control • Microscope • Light: wavelength, intensity • Image acquisition • Type of live-cell imaging experiments
Contamination in cells will affect your experiment And Mycoplasma!
Media types in human cells • Need FBS • DMEM/RPMI: culture media, contains phenol red, which causes background fluorescence! • CO2-independent media –for long experiments • Leibowitz L15 media, no phenol red!
Holders Must have a #1.5 coverslip (0.17mm thick)
Maintaining live cells on the microscope • Tight control of the environment is critical for successful live-cell imaging • Heat within the specimen chamber or chamber holder • Warm air stream over the stage • Enclose the stage area/whole microscope • Use CO2-independent media • Use CO2 source
Heated objectives • Alternatively, need to heat the chamber and lense for 2-4hrs as lenses expand with heat • Microscope also needs to be stable
Your microscope: temperature control • Heat within the chamber holder • Warm air stream over the stage • Enclose the stage area • Enclose the entire microscope
Your microsocope • Active correction: • Autofocus-Not ideal: extra light exposure and change plane in x, y, z • Active Z position monitoring: Nikon and Zeiss • Long term focus stability-important for time lapse work, not as important for short term observations with operator present
Perfect focus • To overcome drift due to mechanical and thermal changes over time
Other features of microsocopes useful for cell imaging • Keep the exposure constant • Motorised stage to follow multiple cells (also need appropriate software) • Shutter on illuminators so that the cells don’t bleach
Photodamage • Live cells poorly tolerate high exposure to light-true for transillumination and epifluorescence: cell death, compromised cell function and stress • Targets: the cell, the medium, the fluorophore • Generation of reactive oxygen species • Blue light is very toxic to cells • The longer the wavelength, the better • You have to compromise!
Light flux at specimen • Illumination system: • 75W Xenon arc • 490/10nm exciter filter (60%T) • 505nm dichromatic mirror (85% reflectance) • Flux at specimen: 380W/cm2 • 2500 times the flux of sunlight on the brightest day!
Minimize the exposure to the necessary for your experiment, not to make a pretty movie Kinetochore tracking in 3D 20 z-sections Every 7.5s seconds 5 minutes That’s a lot of exposure!
Minimum exposure to reduce photodamage Use a minimal exposure to maximize your data collection. Kinetochores are still there after 4min! Deconvolution (1cycle) can help restore your signal for presentation purposes.
Type of live-cell imaging experiments one might do • Time-lapse imaging (BF or TIRF) • Photoactivated localized microscopy-PALM • Fluorescence Recovery After Photobleaching-FRAP • Fluorescence Correlation Spectroscopy-FCS • Fluorescence Speckle Microscopy-FSM • Fluorescence Resonance Energy Transfer-FRET
TIRF imaging of cells to image processes close to the membrane and focal adhesion
TIRF resolution in live-cell imaging • 100-250nm in z-axis • The evanescent field, resulting from total internal reflection of the beam excites fluorophores in a SMALL volume, close to the coverslip. Therefore sample photobleaching is very low
Fluorescence Recovery After Photobleaching-FRAP to look at 2D diffusion Very good for membrane dynamics
Photoactivation to determine movement of molecules and lifetime of subcellular structures
FluorophorePhotoconversion • EosFP is a green fluorescent protein (emits at 516nm) from stony coral • Near-UV radiation induces a conformational change in the protein • Protein emission at 581nm • Especially good for cell tracking in organisms
Fluorescence speckle microscopy to look at motion and turnover of macromoleulcar assemblies Courtesy of M. Mendosa/S. Besson
FSM gives information on flux and movement of actin during migration Courtesy of M. Mendosa/S. Besson
Quantitative analysis of FSM imaging gives information on actin movement during cell migration Courtesy of M. Mendosa/S. Besson
Intensity Wavelength Excitation Emission Excitation Emission FRET Fluorescence resonance energy transfer (FRET) • FRET involves non-radiative energy transfer between donor and acceptor fluorophores • Occurs over distances of 1-10 nm • Emission and excitation spectrum must significantly overlap • Can be used to measure close interaction between fluorophores and as a ‘spectroscopic ruler’ to measure intermolecular distance Donor molecule Acceptor molecule
Fluorescence resonance energy transfer (FRET) Example: the emission and absorption spectra of cyan fluorescent protein (CFP, the donor) and yellow fluorescent protein (YFP, the acceptor), respectively. CFP & YFP pair is currently the ‘best’ for FP-based FRET.
An Aurora B FRET probe as a tool to monitor differential phosphorylation Donor Acceptor Violin et al. 2003 Fuller et al. 2008 We;burnrt al, 2010 FRET occurs when it is not phosphorylated
Aurora B phosphorylation varies with substrate position Decreasing phosphorylation Michael Lampson, Dan Liu
Donor molecule Acceptor molecule Emission Excitation No FRET Intensity Wavelength Donor molecule Acceptor molecule Excitation Emission Emission FRET Intensity Wavelength Fluorescence resonance energy transfer (FRET) An important control in FRET studies is to photobleach the acceptor and demonstrate that donor emission does NOT decrease