Download
1 / 12
120 likes | 183 Views
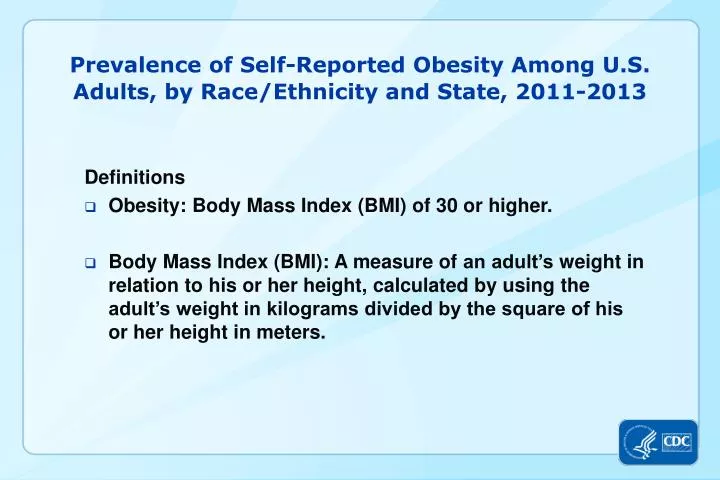
Prevalence of Self-Reported Obesity Among U.S . Adults, by Race/Ethnicity and State, 2011-2013. Definitions Obesity: Body Mass Index (BMI) of 30 or higher.

E N D
Prevalence of Self-Reported Obesity Among U.S. Adults, by Race/Ethnicity and State, 2011-2013 Definitions • Obesity: Body Mass Index (BMI) of 30 or higher. • Body Mass Index (BMI): A measure of an adult’s weight in relation to his or her height, calculated by using the adult’s weight in kilograms divided by the square of his or her height in meters.
Prevalence of Self-Reported Obesity Among U.S. Adults, by Race/Ethnicity and State, 2011-2013 Method • The data were collected through the Behavioral Risk Factor Surveillance System (BRFSS), an ongoing, state-based, telephone interview survey conducted by state health departments with assistance from CDC. • Height and weight data used in the BMI calculations were self-reported. • Three years of data were combined to ensure sufficient sample size.
Prevalence of Self-Reported Obesity Among U.S. Adults, by Race/Ethnicity and State, 2011-2013 Exclusion Criteria Records with the following were excluded: • Height: <3 feet or ≥8 feet • Weight: <50 pounds or ≥650 pounds • BMI: <12 kg/m2or ≥100 kg/m2 • Pregnant women
Prevalence of Self-Reported Obesity Among Non-Hispanic White Adults, by State, BRFSS, 2011-2013 Data not reported* 15%–<20% 20%–<25% 25%–<30% 30%–<35% ≥35% * Sample size <50 or the relative standard error (dividing the standard error by the prevalence) ≥ 30%.
Prevalence of Self-Reported Obesity Among Non-Hispanic White Adults,by State, BRFSS, 2011-2013 Source: Behavioral Risk Factor Surveillance System, CDC.
Prevalence of Self-Reported Obesity Among Non-Hispanic White Adults,by State, BRFSS, 2011-2013 Summary • 2 states (Colorado and Hawaii) and the District of Columbia had a prevalence of obesity less than 20%. • 12 states had a prevalence of obesity between 20% and<25%. • 26 states had a prevalence of obesity between 25% and<30%. • 10 states had a prevalence of obesity between 30% and<35%. • No state had a prevalence of obesity of 35% or greater. http://www.cdc.gov/obesity/data/prevalence-maps.html
Prevalence of Self-Reported Obesity Among Non-Hispanic Black Adults, by State, BRFSS, 2011-2013 Data not reported* 15%–<20% 20%–<25% 25%–<30% 30%–<35% ≥35% * Sample size <50 or the relative standard error (dividing the standard error by the prevalence) ≥ 30%.
Prevalence of Self-Reported Obesity Among Non-Hispanic Black Adults, by State, BRFSS, 2011-2013 *Sample size <50 or the relative standard error (dividing the standard error by the prevalence) ≥ 30%. Source: Behavioral Risk Factor Surveillance System, CDC.
Prevalence of Self-Reported Obesity Among Non-Hispanic Black Adults, by State, BRFSS, 2011-2013 Summary • No state had a prevalence of obesity less than 20%. • 3 states (Maine, North Dakota, and Vermont) had a prevalence of obesity between 20% and<25%. • 4 states had a prevalence of obesity between 25% and<30%. • 12 states had a prevalence of obesity between 30% and<35%. • 28 states and the District of Columbia had a prevalence of obesity of 35% or greater. http://www.cdc.gov/obesity/data/prevalence-maps.html
Prevalence of Self-Reported Obesity Among Hispanic Adults, by State, BRFSS, 2011-2013 Data not reported* 15%–<20% 20%–<25% 25%–<30% 30%–<35% ≥35% * Sample size <50 or the relative standard error (dividing the standard error by the prevalence) ≥ 30%.
Prevalence of Self-Reported Obesity Among Hispanic Adults, by State, BRFSS, 2011-2013 Source: Behavioral Risk Factor Surveillance System, CDC.
Prevalence of Self-Reported Obesity Among Hispanic Adults, by State, BRFSS, 2011-2013 Summary • The District of Columbia had a prevalence of obesity less than 20%. • 4 states had a prevalence of obesity between 20% and<25%. • 23 states had a prevalence of obesity between 25% and<30%. • 18 states had a prevalence of obesity between 30% and<35%. • 5 states had a prevalence of obesity of 35% or greater. http://www.cdc.gov/obesity/data/prevalence-maps.html