Download

1 / 26
260 likes | 323 Views
South Africa PRIMA Operating Rules. Trans-boundary Operating Process. Local Water Management Authority. Operational Committee Representatives for water management institutions (WUA, CMA etc). PRIMA ,TPTC etc. Trans-boundary Agreement. Define integrated operating objectives. Model.

E N D
South Africa PRIMA Operating Rules
Trans-boundary Operating Process Local Water Management Authority Operational Committee Representatives for water management institutions (WUA, CMA etc) PRIMA ,TPTC etc Trans-boundary Agreement Define integrated operating objectives Model Determine operating rule Compliance check PRIMA Operations Task Team/Data Unit Current catchment conditions Model Determine operations for next season (Restrictions)
System interactions MIS Super user -Access and change everything DSS Operator Water use Operator -Access limited through GUI Operating Rules Dam Levels Mike Basin Viewer -Access limited cannot change system information
Operating Rules Process • Define operating objective • Per catchment resource • Integrated operating objective (international and ecological requirements) • Short term/Compliance • -Compliance • -Operating rule • -Dam levels • -Releases • -Restrictions • -Water use (Water balance) • -Flows (Environmental requirement) • Determine operating rule • Per catchment/dam • Integrated operating rule • Review operating rule • -Determine critical period • Test medium term operations • Stochastic runs • Dam trajectories • Check assurance of supply
Example Developing and Operating Rule Define the operating objectives • Use water from run of river first then if this is not sufficient release water from Kwena Dam • Normal: • Dam level should be back above 90% the next May. An increase in dam level of more than 40% can be expected from November to May. • Dam level should preferably not go down below 60% but be kept above 50% as far as possible. • Restrictions should normally be implemented from May to October/November. Conservative approach in winter months • Wet season turning about November/December dam fills. Generally keep dam level to 60% at 15 December.
Example Developing and Operating Rule Define the operating objectives • Drought: • Dam level should at least be back at 70% if the previous year was a drought year. Increase in dam level of 30% to 35% could be expected if it is a dry year again. • Dam level should not go down below 35% but preferably be kept above 40% under these conditions. • If it is the third or fourth year of a drought and still a dry year ahead under these conditions it is possible to go down to below 20% but not lower than 15% depending on the time of the year and the forecast. • In a drought we assume the turning point to be much later and we work on the end of January.
Example Developing and Operating Rule Determine the operating rule • Normal condition • Choose representative hydrological sequence (50th percentile) • Choose a dam level and iteratively restrict users in so that we reach a level of 90% at May the next year • Change the dam level and repeat the process • Create a curve showing restriction level versus dam level for normal condition • Drought condition • Choose representative hydrological sequence (25th percentile) • Choose a dam level and iteratively restrict users in so that we reach a level of 70% at May the next year • Change the dam level and repeat the process • Create a curve showing restriction level versus dam level for normal condition Two curves generated for drought and normal condition
Example Developing and Operating Rule Determine the operating rule
Example Developing and Operating Rule Review operating rules
Example Developing and Operating Rule Review operating rules
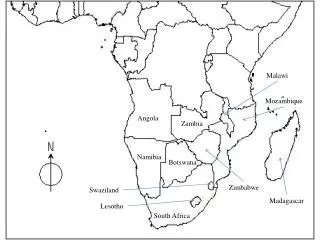
Integration Mozambique Wit Crocodile Kaap
System Overview • Purpose: Give good general overview of system allowing manager to identify problems quickly • Critical information presented on • Dams • Flows • Water Use • Missing information
System Overview (Double click on elements for more information) Prima Operations Home Dams Flows Water use Flow: Meets IIMA Not compliant Water use: 0-25% 25%-50% 50%-75% 75%-100% >100% Dam Level:
Pongolapoort Dam Prima Operations Home Dams Flows Water use Volume: 1 200 000 m3 Percentage full: 70% Storage capacity: 780 000 m3 Inflow: 120 m3s-1 Release: 90 m3s-1 Time series graphs Release comparison Release Status Forecasted Dam Trajectories Comparative Dam Trajectories
Pongolapoort Dam Prima Operations Home Dams Flows Water use Volume: 1 200 000 m3 Percentage full: 70% Storage capacity: 780 000 m3 Inflow: 120 m3s-1 Release: 90 m3s-1 Time series graphs Release comparison Release Status 1 Forecasted Dam Trajectories Comparative Dam Trajectories
Pongolapoort Dam Prima Operations Home Dams Flows Water use Volume: 1 200 000 m3 Percentage full: 70% Storage capacity: 780 000 m3 Inflow: 120 m3s-1 Release: 90 m3s-1 1 month average 3 month average Time series graphs Release comparison Release Status 2 Forecasted Dam Trajectories Comparative Dam Trajectories
Pongolapoort Dam Prima Operations Home Dams Flows Water use Volume: 1 200 000 m3 Percentage full: 70% Storage capacity: 780 000 m3 Inflow: 120 m3s-1 Release: 90 m3s-1 Time series graphs Release comparison Release Status Forecasted Dam Trajectories Comparative Dam Trajectories
Pongolapoort Dam Prima Operations Home Dams Flows Water use Volume: 1 200 000 m3 Percentage full: 70% Storage capacity: 780 000 m3 Inflow: 120 m3s-1 Release: 90 m3s-1 Time series graphs Release comparison Release Status Forecasted Dam Trajectories Comparative Dam Trajectories
Pongolapoort Dam Prima Operations Home Dams Flows Water use Volume: 1 200 000 m3 Percentage full: 70% Storage capacity: 780 000 m3 Inflow: 120 m3s-1 Release: 90 m3s-1 Time series graphs Release comparison Release Status Forecasted Dam Trajectories Comparative Dam Trajectories
Prima Operations Home Dams Flows Water use Komatipoort Weir
Prima Operations Home Dams Flows Water use Water use information can be incorporated into the system However Existing water use data is not reliable and methodology for the collection of this information is not well established. Many areas no water meters are available and assessments based on remote sensing information tend to be inaccurate.
Prima Operations Home Dams Flows Water use Idea for identification of water use Run a water balance Loss/Gain = Upstream gauge + Tributaries (n) – Downstream gauge – estimated evaporation – Estimated seepage Loss/gain vs Allocation