Download

1 / 17
170 likes | 275 Views
Discover the potential in the booming U.S. electricity market by leading large-scale solar PV projects strategically. Take advantage of renewable energy requirements, RFP opportunities, and maximize ROI with planned utility-scale installations.

E N D
PV Market - Electricity Demand “U.S. electricity demand is growing at twice the pace new supplies are being added, an imbalance that could lead to supply problems in a couple of years, an electric-industry group said. In its latest 10-year forecast, the North American Electric Reliability Corp., or NERC, found supplies thinning fastest in California, the Rocky Mountain region, New England, Texas, the Midwest, and the Southwest… “ “…the nation’s 10 big grid running organizations said in a report released yesterday that 44% of the proposed new power generation in their markets is expected to come from renewable-energy projects…” WSJ Oct. 17, 2007
Central Power CSP Generationor versus PV / Photovoltaic • Solar PV uses no water, CSP uses high amounts • Solar PV has a 40 year system life, CSP is only 15 • Solar PV uses DC to AC invertors, not a power box, thus power factor correction is possible and losses are minimized over a generator set. • Ongoing O&M budget for CSP is approx $3/W over the project life vs. less than $1/W for PV.
PV Market - RPS Requirements DSIRE: www.dsireusa.org September 2007 MN: 25% by 2025 (Xcel: 30% by 2020) ME: 30% by 2000 10% by 2017 - new RE VT: RE meets load growth by 2012 *WA: 15% by 2020 ND: 10% by 2015 • NH: 23.8% in 2025 WI: requirement varies by utility; 10% by 2015 goal MA: 4% by 2009 + 1% annual increase MT: 15% by 2015 OR: 25% by 2025(large utilities) 5% - 10% by 2025 (smaller utilities) RI: 16% by 2020 CT: 23% by 2020 • *NV: 20% by 2015 IA: 105 MW • NY: 24% by 2013 • CO: 20% by 2020(IOUs) *10% by 2020 (co-ops & large munis) IL: 25% by 2025 • NJ: 22.5% by 2021 CA: 20% by 2010 • PA: 18%¹ by 2020 MO: 11% by 2020 • MD: 9.5% in 2022 • NC: 12.5% by 2021(IOUs) 10% by 2018 (co-ops & munis) • AZ: 15% by 2025 • *DE: 20% by 2019 • DC: 11% by 2022 • NM: 20% by 2020(IOUs) 10% by 2020 (co-ops) *VA: 12% by 2022 TX: 5,880 MW by 2015 HI: 20% by 2020 State RPS State Goal • Minimum solar or customer-sited RE requirement * Increased credit for solar or customer-sited RE ¹PA: 8% Tier I / 10% Tier II (includes non-renewables) Solar water heating eligible
PV Market - Solar RPS • CO - 4% of RPS; half of solar must be net-metered { Retail } • DE - 2.005% photovoltaics by 2019 • DC - 0.386% solar by 2022 • FL - 2.0% by 2020 for solar thermal and solar PV • MD - 2% solar electric in 2022 • NV - 5% of energy portfolio must be solar 2015 • NH - 0.3% solar electric by 2025 • NJ - 2.12% solar by 2021 (1,500 MW ) • NM - 20% of RPS from solar (4% of total sales) • NC - 0.2% solar electricity and thermal energy by 2018 • TX - 500 MW NON-Wind RPS from renewables other than wind • PA - Solar PV set-aside of 0.5% for June 1, 2020 • Ontario – New Feed In Tariffs ~ 40 cents KW-H • Germany – 42% Feed in Tariffs • Spain – 30% • Portugal – 35% • Italy – 45%
PV Market - Renewable RFPs • Progress Energy Carolinas RFP seeking up to 1,000,000 MWh from RPS eligible Renewable Energy Resources. • Georgia Power RFP seeking up to 4,000 MWh of Wind and Solar Resources to meet the needs of its Green Energy Program. • Long Island Power Authority (LIPA) RFP seeking up to 300 GWh/year of Eligible Renewable Energy Resources and/or Renewable Energy Certificates (RECs). • Western Area Power Administration's (WAPA) RFP seeking firm purchase power contracts for up to 200 MW of Renewable (and/or non-renewable) Energy Resources for the Upper Great Plains Region. • PNM & Duke Energy Indiana RFP seeking up to 200 MW of Renewable & Sustainable Energy Resources. • Florida Municipal Power Agency (FMPA) RFP (#2007-106) seeking up to 100 MW of Eligible Photovoltaic Resources for FMPA's All-Requirements Power Supply Project. • Southern California Public Power Authority (SCPPA) RFP (PDF 44 KB) seeking up to 315 MW of Renewable Energy Resources that comply with the California Energy Commission Renewable Energy Portfolio Standard Guidelines. • Dominion Resources Services RFP seeking Eligible Renewable Energy Resources &/or Renewable Energy Credits (RECs) in Virginia, North Carolina, and PJM Interconnection area to meet State goals and mandates within its service areas. • Arizona Public Service Co. and the Joint Development Group RFP for up 250 MW of Concentrating Solar Power Resources in Arizona or Nevada. • Spark Energy Texas RFP seeking 100MW of Renewable Energy + Constellation New Energy hybrid QSE
Strategy • To be the leader in large scale solar PV power parks from 5MW to 200MW. • Target projects based on market conditions to provide the greatest ROI, still recognizing the pending huge potential in Texas. • Engineer, Design and Construct utility scale solar parks through strategic partnerships like: • Provide ongoing operations and management. • Seeking long-term PPAs with utilities, REPs, generators, and large industrials with MPAs. • Identify and act to control Land Resources and opportunities • PV Generation Projects can be brought on-line faster than conventional power projects. Estimated at 16 months for 50 MW. • Speed will be a greater factor as demand outpaces electricity supply.
Development Properties { LAND } • Falcon has completed a Texas & lower WEC Site survey of over 100 locations with 15 MW or greater of Transmission Capacity & existing onsite sub-station for interconnect. • Falcon is in final negotiation to purchase two {2} 750 to 1280 acre sites in Alpine, Texas, each with sub-station and transmission capacity available for up to 350 MW for “TEXAS SOLAR ONE”. • Falcon has identified numerous other sites on four other West bound circuits with intrinsic development value. • Falcon has two sites in a feasibility study in New Mexico’s WEC for PNM & Exel. • Principals of Falcon own part of 18,000 + acres in Texas WEC with large solar, coal, geothermal and uranium resources onsite.
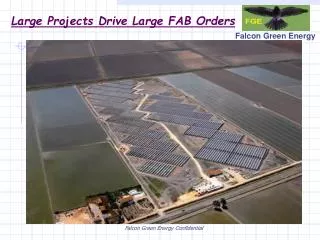
Typical Utility Scale Projects Fort Davis Mountains, TX Thin Film in Eupron, Germany
Current Large Utility Scale Projects • Internal Projects • Alpine Solar Park - 100MW project • Currently in talks with large power users within ERCOT. • Several Suppliers in deregulated markets want MPA quotes for 40 + MW in Texas • Austin - 50MW GLO project at Saragosa • 400 MW of capacity at PECOS - Guadalupe Site for MESA Power • PEC, CPS & BB + AE = 100 MW buying pool distributed at PEC Western Edge !! • Mexico – 45MW Project Proposal being submitted to large Industrial user • “Los Pueblos de Luz” - 3 GW GigaWatt plan named by TekSUN Founder Dan Vogler, “Los Pueblos de Luz” is a 15 year rural electrification plan, in 5,000 off-grid projects for remote villages throughout Mexico. A Future model for Central & South America and Africa. Initial funding will come from the WB World Bank and International Development Fund Banks. • External Projects Falcon may co-develop with other sponsors • 100MW {pending} order for the Northeast region • Several proposals for 1.5 MW to 50 MW • NM, CA, CO, NV, NJ, PA, NY & Ontario targeted for solar park projects. • CO – 25MW+ RFP ; NM Feed-In final • Continue to respond to RFPs as they come out.
Strategic Relationships • Richard Green -Architect – West Texas Sites • Texas Solar Company – Solar power park build-out contractor ( Lead of Five ) • VERDE ENERGY – Solar build-out contractor labor selection & management • Good Company Associates – Utility business development, policy & consulting • GT Environmental – Renewable energy, LEED and carbon credit trading • Janet Hughes - Global Designs – 3rd Party Solar Park Project management • Concurrent Designs - Structural Engineering • Naismith Engineering - Civil & Permitting Engineers { Alpine City Engineers } • Robert Webb – Chairman of TREIA & former Baker Botts attorney currently working in the renewable energy space assisting in the retail electricity market • Andrews Kurth, LLP – Attorneys in Austin, NYC & Washington, DC • Baker Botts, LLP – Renewable energy attorneys, Austin & Houston, TX • Parsons & Associates – Commercial & Ranch Land Real Estate Broker • Texas GLO – General Land Office – Land Resource Leases • BLM – Federal Bureau of Land Management – Land Resource Claims
The Revenue Model:Panels Make Power that Makes $Money Solar Insolation for Puebla Tepeaca, Mexico = 5.33 Average This equates to a 25% Annualized Capacity Rating for 45 MW. Income – Debt = NET;……… Thus total power is produced for sale is: 24 hours x 25% x 365 x 45 MW = 98,550 MW-H per year. CAPEX is $4.50 per watt total PV+BOS installed for 45 MW,….. or $202M With 30% ITC and a $120 / MW-H ; PPA for a 20 year term,… then equals an $80 / MW-H debt service +O+M = $40 / MW-H gross ! Thus, for a 45 MW Solar Power Park,… $120/MW-H - $80 debt = $40/MW-H 98,500 MW-H x $40/MW-H = $4M / yr GROSS MARGIN to Developer, not counting the monetization of RECS, Carbon Credits, ITCs & PTCs*, project depreciation, power buy-downs, power buy-ins, etc.