Download
1 / 8
80 likes | 227 Views
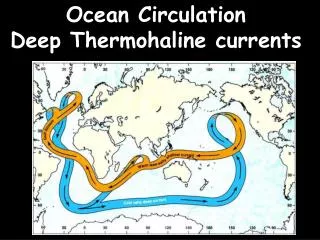
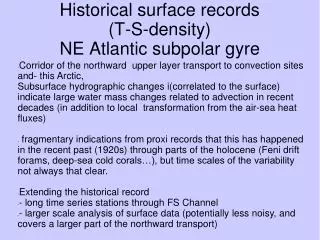
Historical surface records (T-S-density) NE Atlantic subpolar gyre. Corridor of the northward upper layer transport to convection sites and- this Arctic,

E N D
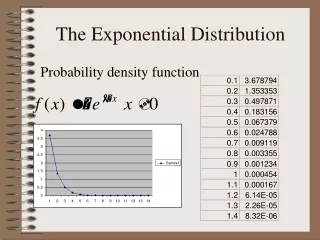
Historical surface records(T-S-density)NE Atlantic subpolar gyre • Corridor of the northward upper layer transport to convection sites and- this Arctic, • Subsurface hydrographic changes i(correlated to the surface) indicate large water mass changes related to advection in recent decades (in addition to local transformation from the air-sea heat fluxes) • fragmentary indications from proxi records that this has happened in the recent past (1920s) through parts of the holocene (Feni drift forams, deep-sea cold corals…), but time scales of the variability not always that clear. • Extending the historical record • - long time series stations through FS Channel • - larger scale analysis of surface data (potentially less noisy, and covers a larger part of the northward transport)
Ride de Reykjanes Norhtward branches The northward branches Eastern part of the subpolar gyre Sensitive to extension fluctuations (gyre circulation) Inter-gyre gyre and MOC intensity Large variability documented in the 1970-2005 period...
Areas regularly sampledVOS – time series stations(less in winter, gaps WWI and WW2)
The data sets Corrected ship-of-opportunity sample data before 1960 (or 1974) (both T and S); some doubts on S correction in 1920s and 1945-55; T correction less than in HadSST2. Validated ship-of-opportunity TSG data since 1994; Other data: no correction… Time series created separately for different seasons and boxes.Correlation between March-May and June-July (both for T and S) and spatially across the domain.
T very similar to HadSST2 (except warming tendency larger), and average of the boxes similar. S presents small negative tendency (-0.035 psu) but changes in data/methods: uncertainties in standarts before 1905; Ways of sampling and measure… positive errors before WWII and negative errors since the mid-1990s; chlorinity or conductivity derived)
Combining the time series (that are correlated) Filtering decennal And multi-decennal (cut-off 18 years) T-S decennal dont Correlate well (after 1970) (frequency change for T in late 1960s Amplitude change for S 1950-1990
Different seasons (slightly larger signal In late summer) T-S correlated; Notice, however, the difference in the 1920s
Relation to NAO (or changes in Weather regimes, or large westerlies Periods Multi-decennal correlated at 0 or 1 yr lag HF, S correlated with 2-3 yr lags. For T, correlation at 0 lag before 1960; Very weak and 3 year lag after