Satellite Imagery Analysis of Ice Dynamics in Antarctica and Iceland
This report details satellite imagery analysis focused on ice stream dynamics and features in Antarctica and Iceland. It presents observations from various sensors, including the ALI (Advanced Land Imager) and SPOT, highlighting fast and slow ice flows, the presence of crevasses, and ridge formations. Specific case studies from Crary Ice Rise in Antarctica and Hofsjokull glacier in Iceland are analyzed. The results include enhanced power spectrum analysis and edge detection filtering, providing insights into accumulation and ablation areas, as well as glacier facies changes.

Satellite Imagery Analysis of Ice Dynamics in Antarctica and Iceland
E N D
Presentation Transcript
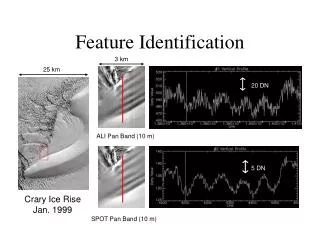
Feature Identification 3 km 25 km 20 DN ALI Pan Band (10 m) 5 DN Crary Ice Rise Jan. 1999 SPOT Pan Band (10 m)
Ice Stream Margin ALI Band 5 (30 m) Ice Stream D, Antarctica fast, crevassed ice flow 100 DN ALI Pan Band (10 m) slow, smooth ridge ice 10 DN 9 km L7 Band 4 (30 m) 2 km
300-m Low-Pass Filter Increased Signal on Ridge Ice 3 km 3 km Power Spectrum ALI Band 5 (30 m, 12-bit) ALI Filtered Power Spectrum L7 Band 4 (30 m, 8-bit) L7 Filtered
Effect of Sastrugi 150 m 600 m 600 m Ice Stream D IKONOS Pan Band 1-m pixels 10-m average 30-m average
A Accumulation area Ablation area B ALI Band 5 A B Glacier Facies Hofsjokull, Iceland September 24, 2001 Transect from the accumulation area to the ablation area
Feature Detection Hofsjokull, Iceland September 24, 2001 Left - ALI Band 5 (0.775-0.890 micrometers); Right - result using edge-detection filtering