Download
1 / 1
10 likes | 203 Views
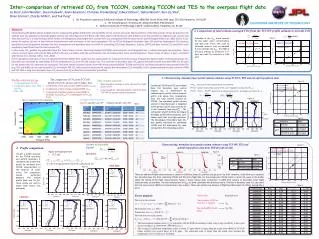
Inter-comparison of retrieved CO 2 from TCCON, combining TCCON and TES to the overpass flight data Le Kuai 1 , John Worden 1 , Susan Kulawik 1 , Kevin Bowman 1 , Christian Frankenberg 1 , Edward Olsen 1 , Debra Wunch 3 , Run -Lie Shia 3 ,

E N D
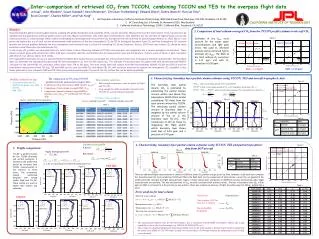
Inter-comparison of retrieved CO2 from TCCON, combining TCCON and TES to the overpass flight data Le Kuai1, John Worden1, Susan Kulawik1, Kevin Bowman1, Christian Frankenberg1, Edward Olsen1, Debra Wunch3, Run-Lie Shia3, Brian Connor2, Charles Miller1, and Yuk Yung3 Jet Propulsion Laboratory, California Institute of Technology, 4800 Oak Grove Drive, Mail stop: 233-200, Pasadena, CA 91109 BC Consulting Ltd., 6 Fairway Dr, Alexandra 9320, New Zealand California Institute of Technology, 1200 E. California Blvd., Pasadena, CA, 91125 CALIFORNIA INSTITUTE OF TECHNOLOGY Abstract: Characterizing the global carbon budget requires mapping the global distribution and variability of CO2 sources and sinks. Measurements of the total column of CO2 by ground or by satellite have the potential to estimate global sources and sinks (Rayner and O’Brien, GRL, 2001, Olsen and Randerson, JGR, 2004) but are less sensitive to regional scale sources and sinks because CO2 is a long-lived gas which makes it challenging to disentangle local sources from CO2 transported into the observed air parcel (Keppel-Alekset al., BGD, 2011). In our poster we explore the use of total column measurements with estimates of the free tropospheric CO2 by TES to distinguish boundary layer CO2 and free tropospheric CO2 because quantify the vertical gradient between the free troposphere and boundary layer is critical for estimating CO2 fluxes (Stephens, Science, 2007) and near surface CO2 should be more sensitive to local fluxes than the total column CO2. In this study, CO2 profiles are estimated from the Total Carbon Column Observing Network (TCCON) measurements and integrated into a column-averaged concentration. These column amount agree with aircraft data within 0.46 ppm, consistent with the uncertainties due to measurement noise and temperature. There is bias of about -5 ppm, consistent with Wunchet al. (Atmos. Meas. Tech. 2010). Free troposphere estimates of CO2 are obtained from the GEOS-Chem model that has assimilated CO2 measurements from Aura Tropospheric Spectrometer. The boundary layer CO2 estimates are calculated by subtracting TES free troposphere CO2 from TCCON column CO2. This estimate of boundary layer CO2 agrees well with aircraft data with RMS of 1.46 ppm for the sixteen PBL CO2 estimates we compared. This work shows that total column from NIR measurements (GOSAT, TCCON and OCO-2) and free troposphere measurement from TIR (e.g. TES and AIRS) can be used to profile CO2 and obtain PBL CO2 with precision necessary to capture the atmospheric CO2 variability. It also shows potential of joint retrieval of NIR and TIR. With a long term boundary layer CO2 record, the CO2 surface flux can be better quantified. 2. Comparison of total column-averaged CO2 from the TCCON profile estimate to aircraft CO2 Estimates of dry XCO2much account for the water vapor concentrations and light path errors. We used O2 retrieved amount and co-retrieved H2O to estimate dry XCO2. The RMS of dry Xco2 without O2 correction is ** ppm and with O2 correction is 0.46 ppm. Figure 3. With O2 Correction Without O2 Correction: 3. Characterizing boundary layer partial column estimates using TCCON, TES and aircraft tropospheric data The comparison of CO2 from TCCON profile retrievals and aircraft overpass data Time window selection : Short enough to measure a same air parcel by flight and TCCON. Long enough for sufficient number of profiles from TCCON for a good statistical treatment. • Profile retrieval set up • 10 retrieved levels for CO2. • Interference gases: H2O, HDO and CH4. • SNR = 200 Figure 5. Comparison of dry mole fraction (DMF) profile: fCO2(z) Comparison of total column-averaged DMF: XCO2 Comparison of partial column-averaged DMF in boundary layer: pXCO2BDL (combining TCCON and TES) Combining TCCON and TES assimilated data, the boundary layer partial column CO2 is determined by subtracting the partial column amount within and above free troposphere from the total column amount by TCCON. The remained partial column amount in boundary layer is weighted by the partial column amount of dry air in the boundary layer for . The comparison of to those by integral the flight profile within boundary layer shows small bias and high precision. The knowledge of boundary layer CO2 was greatly improved by combining TCCON and TES assimilated CO2 data compared to the climatology a priori. Overpass time windows: Figure 4. Figure 1. Covariance for CO2 scaling factor. Lamont: Lat=36°, Lon=-97° Parkfalls: Lat=46°, Lon=-90° Table 1. Pcuf-off Table 2. Convert to dry profile A priori: Retrieved: Characterizing boundary layer partial column estimates using TCCON, TES and partial tropospheric data from SGP aircraft aircraft Figure 7. • Profile comparison: • Apply averaging kernel • FLT_AK: Figure 6. ‘Flt_AK’: a profile accounts for the TCCON sensitivity and vertical resolution. It represents the profile that would be retrieved from TCCON measurements in the absence of other errors. The comparison should performed between the TCCON profile (Ret) and ‘Flt_AK’. These profile are used to obtain total column CO2 estimates. Table 3. TES SGP FLT Park falls: Figure 2. There are additional flight measurements at Lamont in 2009 but these CO2 profiles only go up to 5 to 6 Km. However, it still allow us to compare the boundary layer CO2 from combining TCCON and TES to the flight data. For the comparison of total column, a priori CO2 apply to the profile above the ceiling of the flight measurements. Figure 7 shows sixteen days’ comparison in 2009 from January to December when flight measurements are available. The bias and precision of XCO2 are both consistent with previous results. The bias in boundary layer CO2 stay small but root mean square (RMS) is increased due to two outliers. These two outliers are because of flight boundary layer CO2 falling outside the a priori. 2004/07/12 2004/07/15 2004/08/02 2008/05/12 Table 4. Error analysis • Actual error Expected error Lamont: Time window (STD for clear sky: 0.36 ppm) Day-to-day RMS(0.46 ppm) 2009/01/30 2009/07/31 2009/08/02 2009/08/03 2010/07/18 • The measurement random noise ( ) is consistent with the RMS of estimates within a day. Large variability is due to the cloud coverage (e.g. 2009/03/04, 2009/08/22, etc.). • The average of calculated temperature errors is about 0.7 ppm which is larger than the actual error (RMS of TCCON minus aircraft over several days) of 0.46 ppm. The calculated error is larger than the actual error because the temperature error is likely over estimated.