Download
1 / 1
10 likes | 165 Views
Global Distribution of Aerosol Absorption as Observed by the EOS Aura OMI Sensor Changwoo Ahn 1* , Omar Torres 2 , Pawan K. Bhartia 3 , Marcos Andrade 4 , and Pepijn Veefkind 5 1. SSAI, Lanham, MD USA, (*ahn@chescat.gsfc.nasa.gov ) 2. UMBC/NASA/GSFC, Greenbelt, MD USA

E N D
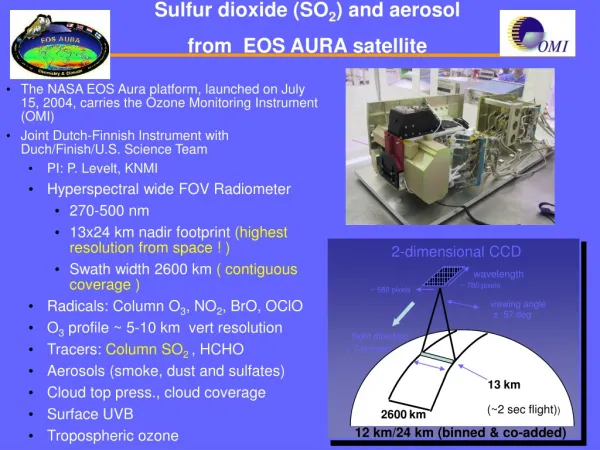
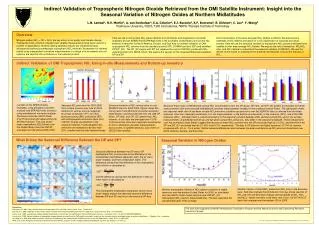
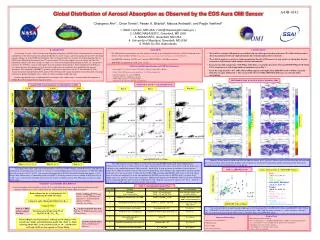
Global Distribution of Aerosol Absorption as Observed by the EOS Aura OMI Sensor Changwoo Ahn1*, Omar Torres2, Pawan K. Bhartia3, Marcos Andrade4, and Pepijn Veefkind5 1. SSAI, Lanham, MD USA, (*ahn@chescat.gsfc.nasa.gov ) 2. UMBC/NASA/GSFC, Greenbelt, MD USA 3. NASA/GSFC, Greenbelt, MD USA 4. University of Maryland, Greenbelt, MD USA 5. KNMI, De Bilt, Netherlands A43B-0142 BACKGROUND For the past 25 years, NASA’s Total Ozone Mapping Spectrometer (TOMS) series of instruments have made great contributions to the observation of the global distribution of aerosol sources, and the transport patterns of UV absorbing aerosols making use of the TOMS Aerosol Index. Here we present results of a recently developed algorithm that uses OMI (Ozone Monitoring Instrument) near UV measurements. We have developed a retrieval scheme that takes the information content in the Aerosol Index to express it as Aerosol Absorption Optical Depth (AAOD). As a quantitative parameter, the AAOD is a more useful quantity than the qualitative Aerosol Index. The availability of AAOD data is very important since the radiation levels at the surface under clear sky conditions are controlled by the aerosol absorption. This algorithm (OMAERUV) produces global daily aerosol retrievals of UV Aerosol Index (UVAI), Aerosol Extinction Optical Depth (AOD), and AAOD. OMI’s near UV unique strength for aerosol detection is the large sensitivity to particle absorption over a variety of surfaces including clouds and snow. Another algorithm that uses a combination of wavelengths in the visible range is currently under development at KNMI (Royal Netherlands Meteorological Institute). • DATA SETS • The OMI global aerosol products are now publicly available at the Goddard Earth Sciences (GES) Distributed Active Archive Center (DAAC) website (http://disc.gsfc.nasa.gov/data/dataset/OMI/Level2/OMAERUV/). • Aqua/MODIS collection-5 AOD Level 2 product (MYDATML2) with 10km resolution. • AERONET Sun photometer AOD Level 1.5data. • CONCLUSIONS • The AAOD is a unique OMI product not available from any other space-based measurement. The OMI AAOD provides a direct measurement of the sun’s light attenuation due to the absorption effects of aerosols. • The AAOD is much less sensitive to cloud contamination than the AOD because it is only sensitive to absorption. For that reason the AAOD tolerates small amounts of cloud contamination. • In general, for daily comparisons, OMI 500nm AOD shows a reasonable agreement with Aqua/MODIS 550nm AOD within 0.15 σ except for cases with strong cloud contamination such as flag 1. • In the low range of AOD (< 0.5), OMI AOD at 388nm appears to be higher than AERONET AOD at 380nm. Generally, both data sets agree within 0.25 σ. The reasons of the observed OMI-AERONET differences are currently under investigation. • EOS-Aura Satellite Specifications and OMI Key Parameters • • Wavelength: UV-1 (270 to 314 nm), UV-2 (306 to 380 nm), Visible (350 to 500 nm) • Orbit: 438 mi (705 km) polar, sun-synchronous, 1:45 PM ascending node • • Spectral resolution: 1.0 - 0.45 nm FWHM • Telescope FOV: 114° (2600 km on ground) • IFOV: 3 km, binned to 13 x 24 km at nadir • Detector: CCD: 780 x 576 (spectral x spatial) pixels OMI Monthly Maps of AAOD & AOD at 388nm for 2006 OMI AOD & AAOD vs. Aqua/MODIS AOD Sample OMI Aerosol Retrievals for Selected Days in 2006 Flag 0+1 UVAI AAOD Flag 0 Flag 1 AOD March July 6, 2006 σ = 0.14 σ = 0.29 May May 14, 2006 OMI AAOD at 500nm AAOD (Flag 0+1) σ = 0.21 σ = 0.55 AOD (Flag 0) OMI AOD at 500nm August March 10, 2006 σ = 0.13 σ = 1.00 November σ = 0.12 σ = 0.69 August 15, 2006 0.0 0.0 Aqua/MODIS AOD at 550nm Monthly average maps of AAOD and AOD for 2006 are shown at 0.5° grid size. Full coverage over the major arid and semi-arid areas of the world is achieved for both products. Observed gaps are associated with persistent cloud contamination. The well known seasonal patterns of aerosol distribution are reproduced. The OMI AOD converted to 500nm was collocated with Aqua/MODIS 550nm AOD within OMI footprints. Collocated sites are shown as white circles on the maps. Generally, both AODs agree within 0.15σ except for flag 1 cases. σ is defined as the standard deviation of OMI (retrieved – fitted) AOD. A large deviation or scatterness between them is mainly due to OMI uncertainties from sub-pixel cloud contamination, aerosol height, types misidentified, and instrumental calibration. Over the coastal zones of China for March 10th, 2006, unusually high MODIS AOD is due to the well-known issue of surface in-homogeneity or water contamination for MODIS aerosol retrieval. MODIS quality assurance flag 2 (good) and 3 (very good) are used for this comparison. OMI AAOD comparison with MODIS AOD clearly shows different clusters indicating different types of aerosols with different SSA. Slope of each cluster is equal to (1.0 – SSA). Some of high values of AAOD might be a mixture of clouds with aerosols. Flag 0 + 1 + 2 + 3 + 4 Flag 0 + 1 + 2 Flag 0 + 2 The figures above show retrieved aerosol parameters of UVAI, AAOD (388nm), and AOD (388nm) with different combinations of algorithm flags (see Table 1) over heavy aerosol loading regions for four selected days in 2006. The OMI data with a grid size of 0.25° x 0.25° was smoothed and projected on NASA’s blue marble background images. UVAI images show all data above 1.0 indicating mostly elevated UV absorbing aerosols even over clouds. AAOD uses flags 0, 1, and 2 and reveals not only absorbing aerosols but also weakly absorbing aerosols. The AOD maps use only data with flags 0 and 2. OMI vs. AERONET AOD Names and Locations of 7 AERONET Stations • Belsk • (20.79°E, 51.84°N) • Blida • (2.88°E, 36.51°N) • IMS-METU ERDEMLI • (34.26°E, 36.57°N) • Kanpur • (80.35° E, 26.45° N) • Mongu • (23.15°E, -15.25°S) • Mukdahan • (104.68°E, 16.61°N) • XiangHe • (116.96°E, 39.75°N) OMI AOD at 388nm OMAERUV ALGORITHM DESCRIPTION A short description of the algorithm (version 1.0.4) is presented in this poster. A more detailed information of the algorithm and data sets is also available from the website given in the DATA SETS description. Table 1. Algorithm/Data Quality Flag σ = 0.25 N = 142 Read radiances for the wavelength pair 354-388nm from the OMI VIS sensor UVAI = -100log10[Iobs/Icalc]354nm where Iobs is the OMI observed radiance, Icalc is the calculated radiance at 354nm when Robs for 388nm Compute Lambert Equivalent Reflectivity (Robs) AERONET AOD at 380nm Compute UVAI SurfCat: CERES surface category data base The scatter plot above is made from the composite of all of match-ups between OMI AOD 388nm and AERONET AOD 380nm over 7 AERONET stations during the period from Jan through Nov, 2006. OMI absorbing aerosols (i.e., smoke and dust) with flag 0 only are used for making match-ups within 15km in 15minuite from each AERONET station. Rsrf : surface reflectivity data base from the V8 TOMS long term record of observations Determine aerosol types using UVAI, SurfCat, & ΔR = Robs - Rsfc • Sources of Uncertainty • Sub-pixel cloud contamination • OMI calibration • Aerosol height • Aerosol type selection • Future Work • Improving instrument calibration. • Use of A-Train data (i.e., CALIPSO, MODIS, Parasol, AIRS) for reducing uncertainties associated with aerosol layer height and sub-pixel cloud contamination. • Refining aerosol types selection scheme. • Assimilating aerosol products with a model. • Direct validation of AAOD. Retrieve/Report aerosol parameters: AOD and AAOD (388nm), UVAI, aerosol types, height, and algorithm/data quality flag (Table 1). Single scattering albedo (SSA) can be calculated as SSA = 1.0 – (AAOD/AOD). AOD and AAOD are also reported at 354 and 500nm. Aerosol height data base from a climatological data base.