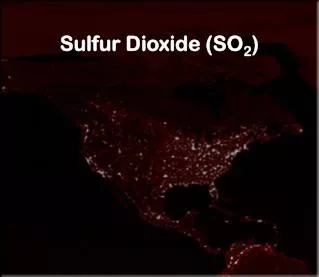
Sulfur dioxide (SO 2 ) and aerosol from EOS AURA satellite
Sulfur dioxide (SO 2 ) and aerosol from EOS AURA satellite. The NASA EOS Aura platform, launched on July 15, 2004, carries the Ozone Monitoring Instrument (OMI) Joint Dutch-Finnish Instrument with Duch/Finish/U.S. Science Team PI: P. Levelt, KNMI Hyperspectral wide FOV Radiometer

Sulfur dioxide (SO 2 ) and aerosol from EOS AURA satellite
E N D
Presentation Transcript
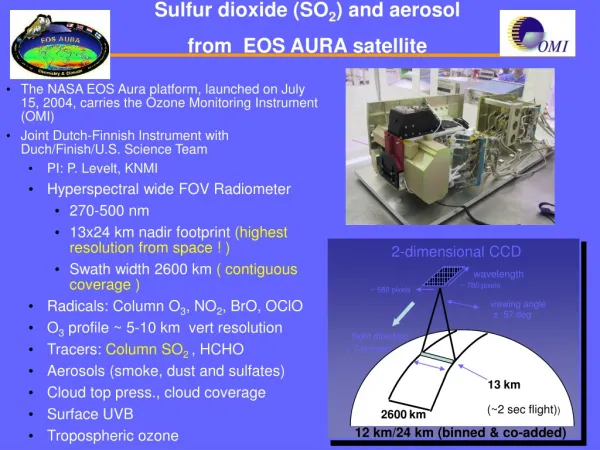
Sulfur dioxide (SO2) and aerosol from EOS AURA satellite • The NASA EOS Aura platform, launched on July 15, 2004, carries the Ozone Monitoring Instrument (OMI) • Joint Dutch-Finnish Instrument with Duch/Finish/U.S. Science Team • PI: P. Levelt, KNMI • Hyperspectral wide FOV Radiometer • 270-500 nm • 13x24 km nadir footprint (highest resolution from space ! ) • Swath width 2600 km ( contiguous coverage ) • Radicals: Column O3, NO2, BrO, OClO • O3 profile ~ 5-10 km vert resolution • Tracers: Column SO2, HCHO • Aerosols (smoke, dust and sulfates) • Cloud top press., cloud coverage • Surface UVB • Tropospheric ozone 2-dimensional CCD wavelength ~ 780 pixels ~ 580 pixels viewing angle ± 57 deg flight direction » 7 km/sec 13 km (~2 sec flight)) 2600km 12 km/24 km (binned & co-added)
Average (2005-2006) SO2 burdens over USA, SO2 emissions have been measured by OMI over Ohio valley in the USA
Average (2005-2006) SO2 burdens over USA,Europe SO2 emissions have been measured by OMI over Ohio valley in the USA Power plants in Eastern Europe Etna volcano in Sicily, Italy
Average (2005-2006) SO2 burdens over USA, Europe and China: East-Aire’05 experiment 25.5 million tons of SO2 was emitted by Chinese factories in 2005 up 27% from 2000
EAST-AIRE regional experiment over NE China in April 2005. SO2 observations from instrumented aircraft flights are compared with OMI SO2 maps. Aerosol Aircraft spirals SO2
OMI 500nm Aerosol Extinction Optical Depth (AOD) shows a reasonable agreement with Aqua/MODIS May August OMI AOD 500nm MODIS AOD 550nm
OMI Aerosol Absorption Optical Depth (AAOD) is a unique product: needs validation ! May August