Download
1 / 1
10 likes | 124 Views
Indirect Validation of Tropospheric Nitrogen Dioxide Retrieved from the OMI Satellite Instrument: Insight into the Seasonal Variation of Nitrogen Oxides at Northern Midlatitudes

E N D
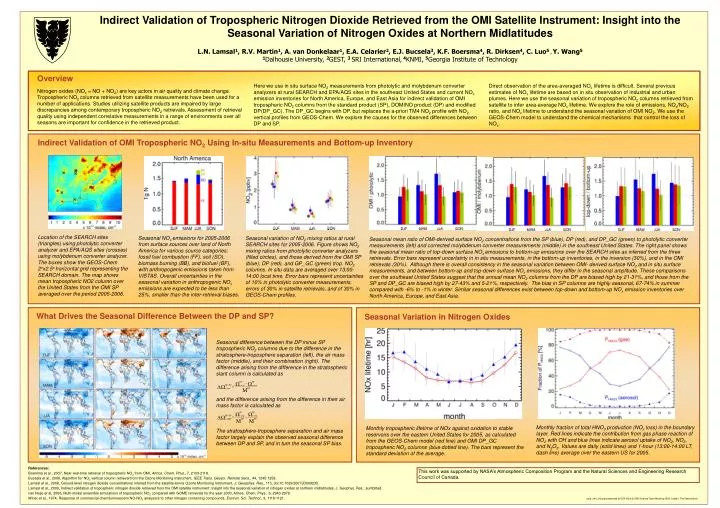
Indirect Validation of Tropospheric Nitrogen Dioxide Retrieved from the OMI Satellite Instrument: Insight into the Seasonal Variation of Nitrogen Oxides at Northern Midlatitudes L.N. Lamsal1, R.V. Martin1, A. van Donkelaar1, E.A. Celarier2, E.J. Bucsela3, K.F. Boersma4, R. Dirksen4, C. Luo5 , Y. Wang5 1Dalhousie University, 2GEST, 3 SRI International, 4KNMI, 5Georgia Institute of Technology Here we use in situ surface NO2 measurements from photolytic and molybdenum converter analyzers at rural SEARCH and EPA/AQS sites in the southeast United States and current NOx emission inventories for North America, Europe, and East Asia for indirect validation of OMI tropospheric NO2 columns from the standard product (SP), DOMINO product (DP) and modified DP(DP_GC). The DP_GC begins with DP, but replaces the a-priori TM4 NO2 profile with NO2 vertical profiles from GEOS-Chem. We explore the causes for the observed differences between DP and SP. Overview Nitrogen oxides (NOx = NO + NO2) are key actors in air quality and climate change. Tropospheric NO2 columns retrieved from satellite measurements have been used for a number of applications. Studies utilizing satellite products are impaired by large discrepancies among contemporary tropospheric NO2 retrievals. Assessment of retrieval quality using independent correlative measurements in a range of environments over all seasons are important for confidence in the retrieved product. Direct observation of the area-averaged NOx lifetime is difficult. Several previous estimates of NOx lifetime are based on in situ observation of industrial and urban plumes. Here we use the seasonal variation of tropospheric NO2 columns retrieved from satellite to infer area-average NOx lifetime. We explore the role of emissions, NOx/NO2 ratio, and NOx lifetime to understand the seasonal variation of OMI NO2. We use the GEOS-Chem model to understand the chemical mechanisms that control the loss of NOx. Indirect Validation of OMI Tropospheric NO2 Using In-situ Measurements and Bottom-up Inventory Location of the SEARCH sites (triangles) using photolytic converter analyzer and EPA/AQS sites (crosses) using molybdenum converter analyzer. The boxes show the GEOS-Chem 2ox2.5o horizontal grid representing the SEARCH domain. The map shows mean tropospheric NO2 column over the United States from the OMI SP averaged over the period 2005-2006. Seasonal NOx emissions for 2005-2006 from surface sources over land of North America for various source categories: fossil fuel combustion (FF), soil (SO), biomass burning (BB), and biofuel (BF), with anthropogenic emissions taken from VISTAS. Overall uncertainties in the seasonal variation in anthropogenic NOx emissions are expected to be less than 25%, smaller than the inter-retrieval biases. Seasonal variation of NO2 mixing ratios at rural SEARCH sites for 2005-2006. Figure shows NO2 mixing ratios from photolytic converter analyzers (filled circles), and those derived from the OMI SP (blue), DP (red), and GP_GC (green) trop. NO2 columns. In situ data are averaged over 13:00-14:00 local time. Error bars represent uncertainties of 10% in photolytic converter measurements, errors of 30% in satellite retrievals, and of 30% in GEOS-Chem profiles. Seasonal mean ratio of OMI-derived surface NO2 concentrations from the SP (blue), DP (red), and DP_GC (green) to photolytic converter measurements (left) and corrected molybdenum converter measurements (middle) in the southeast United States. The right panel shows the seasonal mean ratio of top-down surface NOx emissions to bottom-up emissions over the SEARCH sites as inferred from the three retrievals. Error bars represent uncertainty in in situ measurements, in the bottom-up inventories, in the inversion (30%), and in the OMI retrievals (30%). Although there is overall consistency in the seasonal variation between OMI- derived surface NO2 and in situ surface measurements, and between bottom-up and top-down surface NOx emissions, they differ in the seasonal amplitude. These comparisons over the southeast United States suggest that the annual mean NO2 columns from the DP are biased high by 21-31%, and those from the SP and DP_GC are biased high by 27-43% and 5-21%, respectively. The bias in SP columns are highly seasonal, 67-74% in summer compared with -6% to -1% in winter. Similar seasonal differences exist between top-down and bottom-up NOx emission inventories over North America, Europe, and East Asia. What Drives the Seasonal Difference Between the DP and SP? Seasonal Variation in Nitrogen Oxides Seasonal difference between the DP minus SP tropospheric NO2 columns due to the difference in the stratosphere-troposphere separation (left), the air mass factor (middle), and their combination (right). The difference arising from the difference in the stratospheric slant column is calculated as and the difference arising from the difference in their air mass factor is calculated as The stratosphere-troposphere separation and air mass factor largely explain the observed seasonal difference between DP and SP, and in turn the seasonal SP bias. Monthly fraction of total HNO3 production (NOx loss) in the boundary layer. Red lines indicate the contribution from gas phase reaction of NO2 with OH and blue lines indicate aerosol uptake of NO2, NO3, and N2O5. Values are daily (solid lines) and 1-hour (13:00-14:00 LT, dash line) average over the eastern US for 2005. Monthly tropospheric lifetime of NOx against oxidation to stable reservoirs over the eastern United States for 2005, as calculated from the GEOS-Chem model (red line) and OMI DP_GC tropospheric NO2 columns (blue dotted line). The bars represent the standard deviation of the average. References: Boersma et al., 2007, Near-real-time retrieval of tropospheric NO2 from OMI, Atmos. Chem. Phys., 7, 2103-2118. Bucsela et al., 2006, Algorithm for NO2 vertical column retrieval from the Ozone Monitoring Instrument, IEEE Trans. Geosci. Remote Sens., 44, 1245-1258. Lamsal et al., 2008, Ground-level nitrogen dioxide concentrations inferred from the satellite-borne Ozone Monitoring Instrument, J. Geosphys. Res., 113, doi:10.1029/2007JD009235. Lamsal et al., 2009, Indirect validation of tropospheric nitrogen dioxide retrieved from the OMI satellite instrument: Insight into the seasonal variation of nitrogen oxides at northern midlatitudes, J. Geophys. Res., sumbitted. van Noije et al, 2006, Multi-model ensemble simulations of tropospheric NO2 compared with GOME retrievals for the year 2000, Atmos. Chem. Phys., 6, 2943-2979. Winer et al., 1974, Response of commercial chemiluminescent NO-NO2 analyzers to other nitrogen containing compounds, Environ. Sci. Technol., 8, 1118-1121. This work was supported by NASA’s Atmospheric Composition Program and the Natural Sciences and Engineering Research Council of Canada. aura_omi_no2.ppt presented at EOS Aura & OMI Science Team Meeting 2009, Leiden, The Netherlands