Download
1 / 26
260 likes | 714 Views
Hurricane Katrina Damage Assessment on Lands Managed by the Desoto National Forest using Multi-Temporal Landsat TM Imagery and High Resolution Aerial Photography. Renee Jacokes-Mancini Forest Service Southern Region Jess Clark & Kevin Megown USFS Remote Sensing Applications Center (RSAC).

E N D
Hurricane Katrina Damage Assessment on Lands Managed by the Desoto National Forest using Multi-Temporal Landsat TM Imagery and High Resolution Aerial Photography Renee Jacokes-Mancini Forest Service Southern Region Jess Clark & Kevin Megown USFS Remote Sensing Applications Center (RSAC) GeoSpatial Conference 2007 Portland, OR May 9, 2007
Overview • Background of Hurricane Katrina damage • Need for damage assessment • Method use of assessment • Results • Recommendations
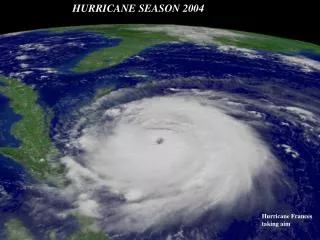
Hurricane Katrina • Hurricane Katrina made landfall in Louisiana and Mississippi and caused extensive damage. • Landfall: August 29, 2005 • Strong Category 3 at landfall • Sustained winds of 111 to 130 mph • Costliest Atlantic Hurricane in U.S. history
June 2005 September 2005 Water Damage
Initial Forest Damage Assessments • Forest Inventory and Analysis (FIA) – September 2005 • Forest Health Protection (FHP) – November 2005 Initial assessments provided little explanation of damage severity or were based on few samples. Different method needed to meet National Forest management information requirements.
New Damage Assessment • Hurricane Katrina made landfall in Louisiana and Mississippi and caused extensive damage. New damage assessment performed by RSAC • Utilizes multi-stage sampling and multiple scales of remotely-sensed imagery • Provides a statistically-defensible approach to mapping damage potential
Desoto NF overlaid on path 21 row 39 Methods - Landsat • Multi-temporal Landsat imagery acquired • Pre-storm: Oct. 15, 2004 • Post-storm: Nov. 3, 2005 • WRS Path/Row: 21/39 • Converted to Reflectance • Other path/rows acquired but sampling performed only on 21/39
Methods - Landsat • Normalized Difference Vegetation Index (NDVI) performed on pre- and post-storm Landsat • Change in NDVI calculated as a continuous dataset • ISODATA Unsupervised Classification performed on NDVI change product • Output: 12 class thematic image
Urban/Ag Masked Out Post-storm Pre-storm Methods – Multi-stage Sample • Built-up, Urban, and Ag areas masked out of Landsat imagery • Those land use types can easily confuse the NDVI change • We are interested in damage to forest
Methods - Photos • The Desoto NF sent RSAC over 400 scanned photos flown by FHTET during October, 2005 • 1:15,840 scale • Flown with Inertial Measurement Unit (IMU) • Photos scanned – 1/2 m pixels • Data compiled into Block Files for Leica Photogrammetry Suite (LPS) • Photos orthorectified using 30m DEM
Methods - Sampling • 12-class raster NDVI change product converted to point coverage • Each point represented center of pixel • 10 points randomly selected from each class • 120 primary sampling units (PSUs) • Assessment done with this dataset to estimate variance and sample needs for whole study
Methods - Sampling • Based off initial assessment, to reach a standard error of 2%, we needed to sample the following: Total: 423 Primary Sampling Units (PSUs)
Methods - Sampling • 423 PSU locations chosen randomly Note: Top and west edges excluded because path 21 row 39 orbit excluded it from the Landsat acquisition.
Size of Landsat pixel over digital photo Methods - Sampling Nearly 4,000 points interpreted for damage – no damage
Methods - Sampling Size of Landsat pixel over digital photo
Methods - Sampling • Digital Mylar – Image Interpreter (ArcMap extension) used to perform damage assessment • 3x3 grid (9 points) centered around PSU • All 9 points fit within one Landsat pixel • Assessed for damage – no damage • Damage = obvious thrown trees
Methods - Analysis • Sample provided basis for % damage estimates with standard errors for each of the 12 NDVI change classes Overall 14.4% of Pts. Attributed as Damaged
Strata Damage (%) Class 11 43.67 4 Class 7 34.10 Class 9 19.36 3 Class 4 18.44 Class 10 13.20 Class 12 12.44 2 Class 6 7.76 Class 3 7.29 Class 8 6.35 Class 2 1.24 1 Class 5 0.43 Class 1 0.00 Methods - Analysis • Student-Newman-Keuls (SNK) Test used to create 4 separable damage classes
Results Class 1 – Lowest probability of damage Class 2 Class 3 Class 4 – Highest probability of damage
Results • Based on the data, less damage than originally assumed was present on the Desoto Ranger District • Original Damage Projects • Final Damage/Harvest
Scan images, compile into block files Photography acquisition begins Begin photo sampling Orthorectify photos Data Analysis Hurricane Day 1 8 10 14 18 22 25 NDVI change products created Landsat acquired Expected Time-Line Needs • Acquisition of aerial photography: Variable – days to weeks • Orthorectification and reprojection of photography: 2 days • Acquisition and processing of Landsat imagery: 2 days • Sampling photography for damage/no-damage: 3 days • Data analysis: 1 day
Discussion • Data-driven damage assessment • Multi-stage sampling design an effective way to assess damage probability • Potential application for future events
Discussion • Not statistical tested/No accuracy assessment • General guide to the savage crew to locate the most affected areas • Quick and efficient way to create damage assessment • Product can be used to help direct salvage and other management decisions
Method Transfer to the Field • RSAC Steering Committee providing 30K • Method Transfer to the field • Texas National Forests • Development of “How to” Documents
Questions For Further information contact: • Renee Jacokes-Mancini rjacokes@fs.fed.us (404) 347-2588 • Jess Clark jtclark@fs.fed.us (801) 975-3769