Download

1 / 85
880 likes | 1.13k Views
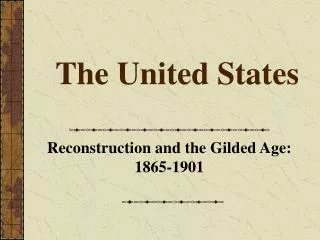
Demography of the United States. s. Introduction. The United States is an urbanized nation, with 80.8 percent of its population of 305,178,872 residing in cities and suburbs as of mid-year 2005.

E N D
Introduction • The United States is an urbanized nation, with 80.8 percent of its population of 305,178,872 residing in cities and suburbs as of mid-year 2005. • The mean population center of the United States has consistently shifted westward and southward, with California and Texas currently the most populous states. • U.S. population growth is among the highest in the developed countries, although its annual rate of 0.88% is below the world average annual rate of 1.16%. • The total fertility rate in the United States estimated for 2008 is 2.1. • Children (people under age 18) made up one-fourth of the US population (24.6%), and people over age 65 one-eighth (12.4%) in 2006.
Historical population rises Historical populations Census Pop. %± 1790 3,929,214 — 1800 5,236,63133.3% 1810 7,239,88138.3% 1820 9,638,45333.1% 1830 12,866,02033.5% 1840 17,069,45332.7% 1850 23,191,87635.9% 1860 31,443,32135.6% 1870 38,558,37122.6% 1880 49,371,34028% 1890 62,979,76627.6% 1900 76,212,16821% 1910 92,228,49621% 1920 106,021,53715% 1930 123,202,62416.2% 1940 132,164,5697.3% 1950 151,325,79814.5% 1960 179,323,17518.5% 1970 203,211,92613.3% 1980 226,545,80511.5% 1990 248,709,8739.8% 2000 281,421,90613.2% June 28, 2008 304,455,000
Historical population rises • 304,455,000 June 28, 2008 • 100 million: around 1915; • 200 million: in 1967 • 300 million: in 2006 • 1.3 percent a year — from about 76 million in 1900 to 281 million in 2000. • Germany, Russia, Italy and Greece, whose fertility rates are below replacement. • Population growth is fastest among minorities (2005), 45% of American children under the age of 5 are minorities. • In 2007, the nation’s minority population reached 102.5 million. A year before, the minority population totaled 100.7 million. • Hispanic and Latino Americans accounted for almost half (1.4 million) of the national population growth of 2.9 million between July 1, 2005, and July 1, 2006.
Leading population centers Rank Core city State Pop. 1. New York City New York 8,250,567 2. Los Angeles California 3,849,378 3. Chicago Illinois 2,833,321 4. Houston Texas 2,169,248 5. Phoenix Arizona 1,512,986 6. Philadelphia Pennsylvania 1,448,394 7. San Antonio Texas 1,296,682 8. San Diego California 1,256,951 9. Dallas Texas 1,232,940 10. San Jose California 929,936
Leading population centers New York City
Leading population centers New York City
Leading population centers New York City
Leading population centers Los Angeles
Leading population centers Los Angeles
Leading population centers Los Angeles
Leading population centers Chicago
Leading population centers Chicago
Population density Rank Country/Region Population Area Density World (land only) 6,655,452,799 148,940,000 44.69 1. Macau (SAR) 538,100 29.2 18,428 2. Monaco 32,671 1.95 16,754 3. Singapore 4,588,600 707.1 6,489 4. Hong Kong (SAR) 7,040,885 1,099 6,407 5. Gibraltar (UK) 27,921 6 4,654 75. PR. China 1,323,324,000 9,596,961 138 180. United States 301,140,000 9,629,091 33.28
Population Density by state Rank (2007) State Density (2007) (per km²) District of Columbia 3,723.37 1. New Jersey 452.16 2. Rhode Island 390.78 3. Massachusetts 317.63 4. Connecticut 279.11 5. Maryland 221.94 6. Delaware 170.87 7. New York 157.81 8. Florida 130.67 9. Ohio 108.12 10. Pennsylvania 107.11
Population Density by state Rank (2007) State Density (2007) (per km²) 11. California 90.49 12. Illinois 89.28 13. Hawaii 77.15 14. Virginia 75.20 15. North Carolina 71.82 16. Michigan 68.46 17. Indiana 68.31 18. Georgia 63.64 19. Tennessee 57.67 20. New Hampshire 56.65
Population Density by state Rank (2007) State Density (2007) (per km²) 21. South Carolina 56.52 22. Kentucky 41.22 23. Wisconsin 39.82 24. Louisiana 38.05 25. Washington 37.53 26. Texas 35.25 27. Alabama 35.21 • U.S. Average 33.28 28. Missouri 32.95 29. West Virginia 29.06 30. Vermont 25.93
Population Density by state Rank (2007) State Density (2007) (per km²) 31. Minnesota 25.21 32. Mississippi 24.03 33. Arizona 21.54 34. Arkansas 21.02 35. Iowa 20.65 36. Oklahoma 20.34 37. Colorado 18.10 38. Maine 16.48 39. Oregon 15.07 40. Kansas 13.10
Population Density by state Rank (2007) State Density (2007) (per km²) 41. Utah 12.43 42. Nevada 9.02 43. Nebraska 8.91 44. Idaho 7.00 45. New Mexico 6.27 46. South Dakota 4.05 47. North Dakota 3.58 48. Montana 2.51 49. Wyoming 2.08 50. Alaska 0.46
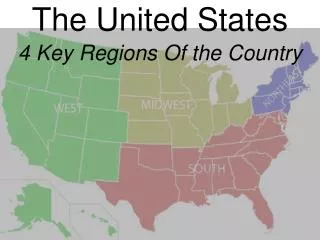
Population movement • In 2000 almost two-thirds of the U.S. population lived in states along the three major coasts— 38% along the Atlantic Ocean, 16% along the Pacific Ocean, and 12% along the Gulf of Mexico. • The smallest numbers lived in the area between the Mississippi River and the Rocky Mountains, particularly in the central and northern Great Plains. • Americans are highly mobile and move an average of 11 to 13 times in their lives. • At the beginning of the 21st century the fastest-growing areas were in the Southeast, especially Georgia, the Carolinas, and Florida
Population movement • Since World War II, people have moved to the Southeast, Southwest, and West Coast(Sun Belt): • Reasons: 1) The economies of these areas were growing. The South and California, in particular, received a disproportionate share of military and government spending during the Cold War. These expenditures created many jobs. A relatively cheap, nonunion labor force in many parts of the South also attracted industry from other parts of the country. 2) The increasingly widespread ownership of automobiles made moving to rural areas easier. 3) Air conditioning made the South more attractive, as did low housing costs and improved public health conditions.
Population movement Sun Belt
Population movement • The areas around the Great Lakes and in the Northeast, which had been major manufacturing centers, lost jobs as industries moved overseas or to other parts of the country since the 1950s. This trend accelerated in the 1970s. • The area around the Great Lakes became known as the Rust Belt because of its closed, deteriorating factories. • Some of the region’s major 19th-century industrial towns—Detroit, Michigan; Gary, Indiana; Akron, Ohio; Cleveland, Ohio; Erie, Pennsylvania; and Buffalo, New York—lost significant population. • The cities that suffered the greatest declines were the ones most dependent on manufacturing. • Other cities in the Northeast and around the Great Lakes—New York, Boston, Philadelphia, Washington, and Chicago—retained their importance as centers of finance, service, government, education, medicine, culture, and conventions, even though population growth slowed or stopped once the industrial base disappeared.
Population movement Rust Belt
Population movement • The older cities have a number of problems: • Roads built decades ago cannot easily accommodate today’s commuter traffic and commercial trucking. • School systems designed to train the next generation for industrial jobs, which are now disappearing, have struggled to meet the educational requirements of new technology-based occupations. • Housing, commercial offices, and manufacturing facilities are outmoded, and • the cost of land and building is relatively high. • In spite of these problems, about one-third of all Americans at the beginning of the 21st century still lived around the Great Lakes and in Northeastern states, and the corridor stretching from Boston to Washington, D.C., remained the most densely settled part of the United States.
Population movement • During the latter part of the 20th century, the largest streams of migrants within the United States were • from New York to Florida, New Jersey, and California; • from Texas to California; • from California to Washington State, Arizona, Texas, and Oregon; and • from New Jersey to Florida and Pennsylvania. • These streams were not one-way: • About 20 percent of these people later returned to their original states, so that many states are losing some people and gaining others. In the 1990s a third of Americans lived in a different state than the one in which they were born, up from a quarter of the population in the late 19th century. Others moved within states.
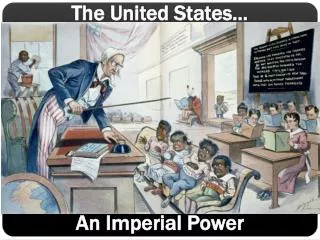
Races and ethnicity • The United States is a diverse country racially and ethnically. • White Americans are the racial majority and are spread throughout the country; • racial minorities, composing one fourth of the population, are concentrated in coastal and metropolitan areas. • Just because the United States is a country of many ethnic groups from different parts of the world, it has long been known as a “melting pot”.
Races and ethnicity • non-Hispanic White Americans (68%) • ancestry to the original peoples of Europe, North Africa, and the Middle East • by way of other countries and regions (for example: Australia, Latin America, South Africa) • Most White Americans are European American, descendants of immigrants who arrived since the establishment of the first colonies. • Non-Hispanic Whites, however, are the majority in forty-six states, with Hawaii, New Mexico, California, and Texas, as well as the District of Columbia, as the exceptions. The latter five have “minority majorities”, i.e. minority groups are a majority of their populations.
Races and ethnicity • Americans of Hispanic origin do not form a race but an ancestral group known as “Hispanic or Latino”, • the largest ancestral minority in the country, composing 14.8% of the population in 2006 and. • Mexican Americans made up 64% of this number, or 28 million, followed next by Puerto Rican Americans with 4 million. • Hispanic and Latino Americans may be of any race. Their racial breakdown in 2006 was as follows: 52.3% White; 41.2% “Some other race”; 3.9% Two or more races; 1.4% Black or African American; 0.75% American Indian or Alaska Native; 0.35% Asian; and 0.09% Native Hawaiian or Other Pacific Islander.
Races and ethnicity • About 12.4% of the American people are Black or African American, most of whom are primarily descendants of Africans who lived through the Slavery era in the U.S. between 1619 and the 1860s and emancipated during the American Civil War. • Black Americans are the largest racial minority as opposed to Hispanics and Latinos, who are the largest “ethnic” minority. • The historical national origin of the majority of Black Americans is untraceable. • Starting in the 1970s, the black population has been bolstered by immigration from the Caribbean, especially Jamaica, Haiti, Cuba, and the Dominican Republic, as well as from South America, primarily from Guyana, Brazil, and Colombia. More recently, starting in the 1990s, there has been an influx of African immigrants to the United States, due to the instability in political and economic opportunities in various nations in Africa. • Historically, most African Americans lived in the Southeast and South Central states of Alabama, Georgia, South Carolina, Louisiana, Mississippi and Texas. • Since World War I there occurred the Great Migration of rural black Americans to the industrial Northeast, urban Midwest and, in a smaller wave, to the West Coast that lasted until 1960. • Today, most African Americans (56%) live in the Southern US and in urban areas, but are increasingly moving to the suburbs.
Races and ethnicity • A third significant minority is the Asian American population, • comprising 13.1 million in 2006, or 4.4% of the U.S. population. • California is home to 4.5 million Asian Americans, whereas 512,000 live in Hawaii, where they compose the plurality at 40% of the islands’ people. • Asian Americans live across the country, and are also found in large numbers in New York City, Chicago, Boston, Houston, and other urban centers. • It is by no means a monolithic group. The largest groups are immigrants or descendants of immigrants from the Philippines, China, India, Vietnam, Cambodia, South Korea and Japan. • While the Asian American population is generally a fairly recent addition to the nation’s ethnic mix, relatively large waves of Chinese, Filipino and Japanese immigration happened in the mid to late 1800s.
Races and ethnicity • Multiracial Americans numbered 6.1 million in 2006, or 2.0% of the population. • They can be any combination of races (White, Black or African American, Asian, American Indian or Alaska Native, Native Hawaiian or other Pacific Islander, “Some other race”) and ethnicities. • The U.S. has a growing multiracial identity movement. Miscegenation or interracial marriage, most notably between whites and blacks, was deemed immoral and illegal in most states in the 18th, 19th and early 20th centuries. California and the western US had similar laws to prohibit White-Asian American marriages until the 1950s. • As society and laws change to accept inter-racial marriage, these marriages and their mixed-race children are possibly changing the demographic fabric of America.
Races and ethnicity A picture of 1899
Races and ethnicity • Indigenous peoples of the Americas, such as American Indians and Inuit, made up 0.8% of the population in 2006, numbering 2.4 million. • An additional 1.9 million declared part-Native American or American Indian ancestry. • Native Hawaiians and other Pacific Islanders numbered 426,194 in 2006, or 0.14% of the population. • Additionally, nearly as many report partial Native Hawaiian ancestry, for a total of 813,474 people of full or part Native Hawaiian ancestry.
Races and ethnicity By country of birth
Races and ethnicity By ancestry
Races and ethnicity • 2008 • Non-Hispanic whites 68% • Hispanic 15 % • African Americans 12% • Asian American 5%
Languages of the United States 2000 census 1. English 215million 82.10% 2. Spanish 28million 10.71% 3. Chinese 2.0million 0.61% 4. French 1.6million 0.61% 5. German 1.4million 0.52% 6. Tagalog 1.2million 0.46% 7. Vietnamese 1.01million 0.38% 8. Italian 1.01million 0.38% 9. Korean 890,000 0.34% 10. Russian 710,000 0.26%
No official language at the national levelEnglish: de facto official language English: official language Two or more official languages No official language English: de facto OL No official language
State Language Meaning Alabama Indian “thicket-clearers” or "vegetation-gatherers" Alaska Aleutian "great land“or "that which the seas breaks against" Arizona Indian "hule spring" Arkansas Indian "a breeze near the ground" California French “Califerne” (an imagined place of an 11th-century epic Colorado Spanish “ruddy” or "red" Connecticut Indian "beside the long tidal river" Delaware English In honor of Sir Thomas West, Lord De La Warr Florida Spanish "feast flowers (Easter)" Georgia English In honor of George II of England. Hawaii Hawaiian In honor of Hawaii Loa, the discoverer Idaho Indian "gem of the mountains“ or "Good morning" Ilinois Indian "tribe of superior men" Indiana Indian "land of Indians" Iowa Indian "the beautiful land“ or "the sleepy ones" Kansas Indian "people of the south wind" Kentucky Indian "land of tomorrow“ or "the dark or fertile ground" Louisiana French In honor of Louis XIV of France Maine English In honor of Queen of Henrietta Maria, Queen of Charles I of England Maryland English In honor of Henrietta Maria, Queen of Charles I of England Massachusetts Indian “great mountain place" Michigan Indian "great lake“ or "big water" Minnesota Indian "sky-tinted water" Mississippi Indian "father of waters" Missouri Indian "town of the Large canoes"
State Language Meaning Montana Spanish ? Nebraska Indian "flat water" Nevada Spanish "snow-capped" New Hampshire English Hampshire New Jersey English the Channel Isle of Jersey New Mexico Mexican “the country of Mexico” New York English "In honor of the English Duke of York" North Carolina English "In honor of Charles I of England". North Dakota Indian "allies“ or "leagued" Ohio Indian "great river" Oklahoma Indian "red people" Oregon English In honor of Robert Rogers, an English army officer Pennsylvania English In honor of Sir William Penn (“Penn's Woodland”) Rhode Island Greek "the Greek Island of Rhodes". South Carolina English In honor of Charles I of England South Dakota Indian "allies“ or "leagued" Tennessee Indian "the vines of the big bend" Texas Indian "friends" Utah Indian "people of the mountains" Vermont French “vert mont” ("green mountain“) Virginia English "In honor of Elizabeth I,Virgin Queen of England" Washington English In honor of George Washington West Virginia English "In honor of Elizabeth I,Virgin Queen of England" Wisconsin French ? Wyoming Indian "mountains and valleys alternating"
South Carolina English In honor of Charles I of England South Dakota Indian "allies“ or "leagued" Tennessee Indian "the vines of the big bend" Texas Indian "friends" Utah Indian "people of the mountains" Vermont French “vert mont” ("green mountain“) Virginia English "In honor of Elizabeth I,Virgin Queen of England" Washington English In honor of George Washington West Virginia English "In honor of Elizabeth I,Virgin Queen of England" Wisconsin French ? Wyoming Indian "mountains and valleys alternating"
Religion and religious belief Percentage of state populations that identify with a religion rather than "no religion", 2001
Religion and religious belief Plurality religion by state, 2001
Religion and religious belief 2001 • Total Christians 79.8% Catholic 25.9% Baptist 17.2% Methodist 7.2% Other Christian 29.5% • Total other religions 5.2% Jewish 1.4% Muslim 0.6% Buddhist 0.5% Hindu 0.4% • No Religion 15.0%