Download
1 / 48
480 likes | 500 Views
This topic focuses on the need for research and improvement in analyzing and predicting the structure changes, significant weather, and ocean impacts associated with Extratropical Transition (ET). It discusses the challenges in defining and forecasting ET, as well as the current methods and diagnostics used in operational forecasting.

E N D
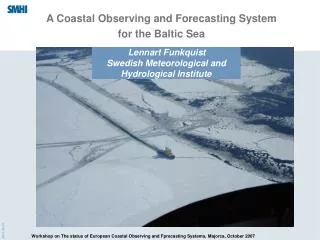
Topic 2.4: Observing and Forecasting Extratropical Transition (ET) Rapporteur Jenni EvansThe Pennsylvania State University Working Group Sim Aberson, Jack Beven, Andrew Burton, Roger Edwards, Chris Fogarty, Bart Hagemeyer, Bob Hart, Naoko Kitibatake, Ron McTaggart-Cowan, David Roth, Joe Sienkiewicz, Scott Spratt, Chris Velden
1. From IWTC-V (Cairns) Research program focusing on ET is needed to (i) improve analyses and prediction of the structure changes, significant weather, and ocean impacts associated with ET (ii) address uncertainties in numerical predictions of ET in the region of the storm (iii) understand the far-field impacts of ET (iv) coordinate with existing programs to obtain detailed observations of the evolutionary structure of extratropical transition
2. Towards An Operational Definition of ET • Lack of an ET definition understood by the general public can result in tragedy when tropical cyclone warnings are discontinued (due to ET) but the storm makes landfall • One solution: CHC labels ET events as “post-tropical” and continue to use the tropical storm name – e.g. “Post-Tropical Cyclone Floyd”
2. Towards an Operational Definition of ET • No uniform approach has been agreed among all affected nations • Development of consistent descriptors and definitions of the stages of ET will help progress in operational forecasting techniques • Need additional observations to develop physically-based ET conceptual models
An effective ET definition should • Be precise enough to satisfy the needs of the operational and research communities • Be accessible to the general public
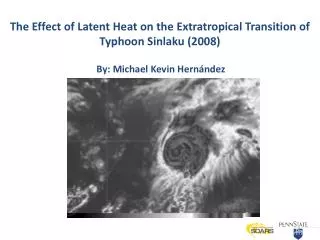
3. Recent observational studies • Hurricane Michael (2000) • First field project focused solely on ET • Canadian National Research Council Convair 580 aircraft • Hurricane Ophelia (2005) • Joint observational missions by U.S. (NOAA/HRD) and Canadian Meteorological Center • Storm undergoing ET between North Carolina, US and Nova Scotia, Canada • 16 September: NOAA P-3 aircraft, U. S. Air Force C‑130‑J aircraft, and Aerosonde • 17 September: NOAA P-3 aircraft only
6 6 6 9 9 9 HWIND Aerosonde Plots/Ophelia 16 Aug, 2005 Satellite image at time of second closest approach of aerosonde to wind center and just after WP-3D SFMR penetration across the eye.
6 6 6 9 9 9 HWIND Aerosonde Plots/Ophelia 16 Aug, 2005 NOAA WP-3D SFMR Surface winds in light blue, aerosonde winds in black, buoy winds in dark blue. Aersonde closest approach to wind center was 30 nm southwest and 25 nm northeast. Peak winds at 2500 ft were 65 kt southeast of center and 75 kt north of center. Excellent agreement was found between buoy, SFMR and aerosonde winds adjusted to surface values. SFMR winds SW of center were within 10 min of aerosonde.
6 6 6 9 9 9 HWIND Aerosonde Plots/Ophelia 16 Aug, 2005 AFRC WC-130J 850 MB winds in red, aerosonde winds in black, buoy winds in dark blue. peak 850 mb winds of 55 kt were 35 nm SE and NE of center, associated with major outer band. Aerosonde flew downwind along major band to east and across major band to north.
4a. Current Methods for Analysing ET • Satellite imagery/analyses, cool SST, weakening (at least initially) • Cyclone Phase Space (CPS; Hart 2003; Evans and Hart 2003) diagnostic of 3D storm structure from operational model analyses and forecasts • Combine with conceptual models – e.g. require significant “transformation” to cold-core, not just poleward track and “capture” in westerlies
Wilma (2005) 13h prior to ET 40°N, 65°W 970hPa, 90kt
Cyclone Phase Space (CPS) Advantages • Highlights the structural changes of the vortex • Straightforward approach to intercomparison of numerical model forecasts of storm evolution • Accessibility of the CPS has led to its use in operational centres in the U.S., Canada, and Australia Disadvantages • Current dependence on model analyses argues against its use in isolation
4b. Current Methods for Forecasting the Timing of ET • As with ET analysis, many operational centers indicate that they combine the CPS with satellite guidance and conceptual models of ET • Blending of these fairly independent forms of guidance to create a forecast remains difficult and subjective
Forecast Diagnostics of Potential Interest to the Forecast Community • Folks @ SUNYA are generating realtime diagnostic displays (archived for ~3 months) http://www.atmos.albany.edu/facstaff/rmctc/DTmaps/animSelect.php • Diagnostics relevant for ET include • Streamfunction (midlatitude features) • Velocity potential (regions of large-scale ascent) • Quasi-geostrophic (QG) analyses
Additional forecasting challenges associated with ET • Storm structural changes during and after ET • Potential for reintensification as an extratropical system is of primary concern • Modify the surface circulation • Redistributing damaging winds over land • Driving ocean surface wave evolution • Coincident modification in the storm precipitation distribution • Possibility of tornadoes during the tropical phase.
I. Storm structural changes during and after ET • No objective product(s) yet exists for specific guidance on the wind field redistribution and reintensification during ET • Operational NWP may be unreliable forecasting cyclone structure through ET • wind field • precipitation distribution downstream cyclone development post-ET intensity track
I. Storm structural changes during and after ET • Use past events to develop operational guidelines for storm changes during ET • Peak winds generally displaced to the equatorward side (right NH; left SH) of the storm track • Surface pressure field spreads near the storm center, resulting in storm size increase and enhancement in outer wind speeds • Rapid motion enhances the across-track asymmetry in storm peak winds
I. Storm structural changes during and after ET • In the later stages of ET, a horseshoe shaped wind maximum in the front half of the storm domain may be observed • Decoupling from the surface over the colder marine boundary layer may result in weaker than expected surface winds; no method yet for discerning these cases • Improved use of ocean surface winds, particularly from the NASA QuikSCAT satellite, has allowed better monitoring of the changes in the cyclone wind field as ET occurs
Evolution of storm size during ET • Storm and environmental modulators of cyclone surface wind structure differ for warm season tropical and extratropical cyclones. • Two datasets of significant wind speed radii in Atlantic storms are available: EBT and H*Wind • Each is internally consistent • Large differences can exist between these datasets on a case-by-case basis • Statistically significant differences in the overall datasets exist • Validation of wind distribution forecast products is problematic because of this
o >TS intensity + no QuikSCAT EBT (x) vs. H*Wind (y) gale radius (Moyer et al. 2006)
Wave field evolution • Transitioning cyclones can become very efficient ocean surface wave producers • Strong winds (equatorward of track) blowing along track can create very high seas due to “trapped-fetch” resonant wave growth • Constant storm movement direction (>18 hours) and fast motion (>10ms-1) needed for trapped fetch • As the storm accelerates and the wind field expands during ET, the wave maximum becomes displaced farther to right (NH) of storm track • Arrival of the wave maximum at a location typically lags storm passage by 2-3 hours
Wave growth time increases with trapped fetch (waves stay with storm) Bowyer and MacAfee (2005)
Wave field evolution • An operational modeling tool to compute dominant wave trajectories and significant wave heights during ET has been implemented in Canada • Wave forecasts from this model are available <1 minute after the forecaster produces or changes the forecast track • Equivalent techniques not yet available in all regions affected by ET events
Precipitation distribution changes • Heavy precipitation zone associated with ET is usually • associated with the tropical cyclone outflow extending poleward from the storm center • within a few hundred kilometers of center • concentrated along quasi-stationary frontal zones well ahead of the storm • on the poleward side of the storm track (“delta” rain region) • substantially less to the equatorward side due to dry air wrapping around that side of the storm
Precipitation distribution changes • ET import of moist tropical air to higher latitudes brings potential for extreme precipitation • Can lead to flash floods • In the vicinity of mountainous regions, upslope flow and precipitation enhancement can exacerbate flooding potential
Subjectiveapproach to forecasting precipitation distribution with ET • When ET is likely and/or fronts are relatively close to the storm center, the forecast region of heavy precipitation is shifted from right to left of track • QPF guidance on more refined spatial scale is derived from the operational model track forecast most similar to the official NHC track forecast • Regions of strongest flow are identified that are > 35 kt perpendicular to a frontal or coastal boundary or local terrain Heavy precipitation is expected in these regions due to strong forced ascent • Other favorable (not ET-specific) indicators of local QPF maxima: around upper-level jet streaks, frontogenesis zones and PV anomalies • Reasonable spatial continuity in the heavy precipitation region ensured through conceptual models current precipitation structure (from radar and satellite) incorporation of diurnal cycle of precipitation use of storm analogs
Subjectiveapproach to forecasting precipitation distribution with ET • Selection of an analog depends on satisfying a number of common criteria (i) size of the current rain shield (ii) vertical wind shear (iii) similar storm track with similar proximity to topography (iv) fronts in the vicinity of the storm (v) susceptibility of location to topographic rainfall enhancement Storms such as Wilma (2005) and Alberto (2006) are exceptions that remain to be explained. • QPF calibration past events (15-25 year dataset) are used to calibrate likely average or extreme QPFs checks are applied on the upper limits of QPF amounts (areal average amounts in the QPF graphics and the text QPF statement to NHC) example: soft cap of 2.5 inches per six-hour period is usually enforced for the 28-km forecast grid Roth (2006, pers. comm.)
Tornadoes associated with ET • Studies of Florida tornadoes reveal an increased likelihood of tornadoes in hurricanes with hybrid characteristics interacting with the mid-latitudes • Compared with purely tropical storms, tornadoes associated with hybrid storm passage are • consistently the most dangerous • result in longer and more active tornado outbreaks • rarest form of warm-season cyclone-related Florida tornadoes
Cyclone Phase Space (CPS) • Hybrid storms in these studies were • interacting with a midlatitude trough to the northwest • accelerating to the north or northeast • at least potentially beginning ET • may provide a useful model for tornado forecasting in other ET events
Tornadoes associated with ET • Most tornadoes occurred in the overrunning zone near or north of a strong low-level jet (>17.5 ms-1) intersecting a surface warm front • This maximizes moisture convergence in a highly sheared, moist environment with diffluence aloft • Tornadic phase likely also associated with • Approach of an upper short wave • An increase of the 850-500 hPa wind speeds • Dry intrusion at mid-levels may be a factor
Tornadoes associated with ET • Significant tornadoes in tropical cyclones with hybrid characteristics most likely in • Fast-moving cyclones • Outer rainbands • June and October (October peak ET month) • Heavy rain phase begins before severe weather phase and continues during, and well after, the tornado outbreak phase • No link between TC and tornado intensity
Climatological studies of ET • Regional climatologies documenting wind, wave and precipitation distributions are needed for • conceptual model development • forecast validation studies • Combine with synoptic composites and numerical studies
Role of Recurving Storms (ET?) in Interannual Variability • Explore relationship between recurving tropical cyclones and the subsequent winter climate • anomalous TC recurvature may lead to anomalous snowcover at the start of winter • does not return to normal by winter's peak • thereby alters the albedo of the hemisphere and the radiative balance
7. Crucial needs for advancement in ET forecasting • Forecasts of the timing of ET • Analyses of storm intensity during ET • Forecasts and verification of cyclone intensity during ET
7. Crucial needs for advancement in ET forecasting • Size forecasts through ET • Verifications of these size forecasts • Precipitation distribution forecasts • Forecasts of the likelihood of tornadoes in early stages of ET This list is very similar to that identified by Jones et al. (2003)!
Improve understanding of the structural changes and impacts during ET to improve • conceptual models • numerical models • forecasting paradigms: enable forecasters to better anticipate changes, and give more detailed warnings associated with ET
Ongoing modeling improvements benefiting ET forecasting • Higher resolution global analyses assimilating an increasing number of observations • improve understanding and aid refinement of conceptual models of the impacts of ET on the larger-scale flow • Evaluations of ensemble-based ET forecasts • map the range of model uncertainty during the ET process • Diagnostics (observational, simulation) of the extent and multi-scale nature of the interactions between the remnant TC and its environment • promising avenues for forecast improvement through both conceptual models and modeling advances
Focused field experiments • Field experiments of opportunity • e.g. US Canada collaboration in Ophelia • THORPEX Pacific Asian Regional Campaign (T-PARC) • in planning stage • presently slated for 2008
1. Improved availability of forecast tools and analyses to forecasters across all affected regions, and 2. Continued communication of recent results between operational and research communities ...remain vital to the advancement of ET forecasting