Map Scale
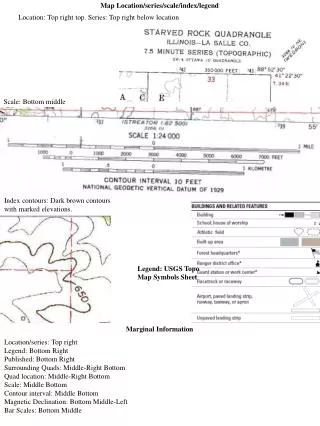
Map scale is the ratio of distance on a map to the corresponding distance on the ground, providing insights into the area covered. For instance, a scale of 1:24,000 indicates that 1 unit on the map equates to 24,000 of the same units on the ground. There are three representations of scale: verbal (e.g., one inch equals one mile), numeric ratio (1:24,000), and graphic scale. Maps can be categorized into large scales with detailed local information and small scales covering larger areas with less detail. Choosing the right scale is crucial for effective map design.

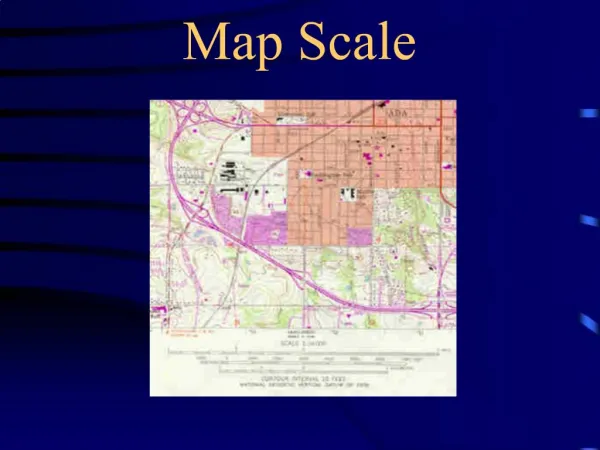
Map Scale
E N D
Presentation Transcript
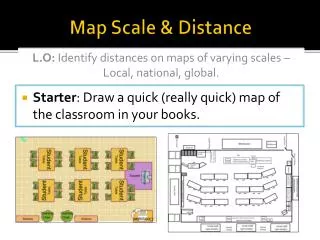
Map Scale Sizing the Model
Map Scale • Ratio of a single unit of distance on map to the corresponding distance measured on the surface of the ground • Gives idea of area covered • Example: If Map scale = 1:24,000 Then 1 unit of measurement on map represents the 24,000 of the same units on the surface of ground
Scale • Three types of scale depictions: • Verbal: One Inch equals One Mile • Numeric Ratio: 1:24,000, Fractional: 1/24,000 • Graphic
Map Scale • How to Calculate Corresponding Distance on Ground Example: Map Scale = 1:200,000 Given Map distance = 3 cm Required x = Equivalent distance on ground The above scale defines that 1 cm on map = 200,000 cm on ground 1/200,000 = 3/x x = 600,000 cm or 6 KM on ground
Quiz Question: Map Scale = 1:24,000 800 ft on ground = ________inch on map?
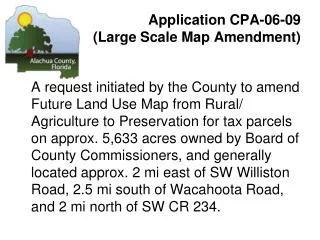
Large Scale vs. Small Scale • Refer to scale shown as a fraction • Large means small denominator and small means larger denominator • Q: which map has a larger scale – 1:1000OR 1:25,000? • Why larger? – shows the features at a larger and more detailed size
Large Scale Map • In larger scaled maps more details but less area covered (for a fix size) • Relatively small portion is covered with higher local detail • Usually maps that are 1:24,000 or larger are considered large scale** ** http://www.esri.com/industries/k-12/PDFs/intrcart.pdf
Large Scale Scale 1: 3,000
Small Scale Map • Relatively large area of Earth is covered • In a smaller scaled map certain features might be omitted • Detail at global level with limited local detail • Usually maps 1:250,000 or smaller are considered small scale** • Any map with scale between large and small scale is intermediate scale maps ** http://www.esri.com/industries/k-12/PDFs/intrcart.pdf
Small Scale Scale 1: 1000000
Medium Scale Scale 1: 200,000
Large Scale vs. Small Scale Reference:
Map Scale • Selection of a scale depends on its intended use • Select a scale which is convenient to handle • Scale will change appropriately as paper scale changes
Map Designing Optimal Representation of Spatial Information
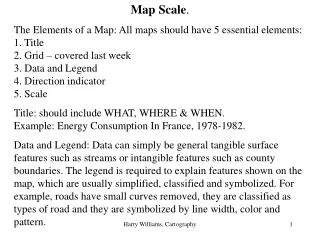
Mapping Prerequisites Keep the following points in mind before designing a Map • Purpose of the map (remember the message) • Context of the map • Potential users • Available resources (data and tools) • Important features which need to be highlighted and less important in the background (not prominent) • Design elements needed to properly communicate the message • Format of the final project
Map Designing • Map Designing Steps • Determine the objectives of the map • Decide on the data layers to be included • Plan a layout • Select only the area of interest • Choose colors and symbols • Map should also look good in black and white • 1 out of 10 people are color blind • Printing in black and white • Use low saturation colors in background • Create the map
Selection of Layers • Most important layers = clearest and largest symbols! • Some ancillary layers help reader to orient themselves • Too many ancillary layers can drown out your message • Make the representation of some ancillary layers less prominent Use: • smaller symbols • smaller text • transparency, etc.
Typography (Labeling) • Simple and brief but accurate • Make sure text is legible • Placement should least obscure underlying information • Font size hierarchy to indicate relative importance • Use no more than four fonts or text sizes on a map • Label outside area only if the purpose is to show the orientation of the study area
Legibility of Text • Typeface • Easy and clear to read • Size • Readable size • Color • Sufficient contrast between background and letters • Line Length • Longer lines are difficult to read • Leading (space between two lines) • Legibility may be increased by increasing the leading between rows of text
Legibility (readability) of Text Source: http://www.kristinlong.com/Typography.pdf
Typography (Conti..) • Traditionally plain font for land and italic font for water features • Label spread out along the feature • Several labeling styles available
Typography (Labeling) Scale 1: 200,000 Scale 1: 10,000
Bad Maps • Poor symbols, poor color, poor design, hard to read, poor legends
Map Types 1. Planimetric (e.g municipal base map) A map designed to portray the horizontal positions of features; vertical information is specifically ignored. 2. Topographic (e.g. USGS 7.5 minute quads) A map designed to portray features on the surface of the Earth, including relief (elevation), hydrography, and cultural features 3. Cadastral (e.g municipal parcel map) A map representing boundaries of land parcels, ownership, land use, valuation, and other related information. 4. Image (e.g LANDSAT image ‘map’) A map representing a remotely sensed picture or reflection of all or part of the Earth's surface 5. Thematic • A map used to visualize spatial relationships and patterns among information pertaining to some theme or concept Reference: Ron Brigg UT Dallas
Representation of Thematic Maps • Choropleth map:uses zones or polygons to display information using shading, dot, density, or other techniques. • e.g population change, ethnicity distribution • Proximal (dasymetric) map: shows zones of constant attributes, such as soil type or vegetation (similar to choropleth except that data determines boundary lines; no pre-defined polygons) • e.g. zoning, soil map • Isopleth map (contour or isarithmic): shows a continuous three dimensional surface such as elevation using lines connecting points of equal value (contours). • e.g elevation, travel time contours from a point(s), land values, income • Point (dot) or symbol map: shows information relating to specific points using marker symbols whose size and/or frequency relates to magnitude of phenomena • housing sales, code violations, crimes Reference: Ron Brigg UT Dallas
Other Thematic Maps • Single symbol maps • Single symbol used for all features • Unique value maps • Different symbols or colors for each category or value
Which Map suites to what data types? • Nominal data_________ Single symbol maps • Categorical data_______ Unique values map • Ordinal data __________ Unique values map • Interval and Ratio data__ Quantities map (graduated color, graduated symbol, dot density)
DataClassification It is a key method of abstracting reality into simplified map Method of classification effects the ‘look’ of the map Classification should match data distribution Distribution of zones into classes Max of 6 number of classes recommended (such that reader can interpret between them)
ClassificationOptions • Natural Breaks • Quantiles • Equal Interval • Standard Deviation
References • http://www.kristinlong.com/Typography.pdf • http://www.state.nj.us/dep/gis/training/scaleaccurlayout.ppt • Introduction to Geographical Sciences, Training Lectures and Presentations Prepared by National Center for Remote Sensing and Geoinformatics (NCRG) Karachi (undated) • GIS Cartography: A Guide to Effective Map Design by Gretchen N. Peterson, 2009