Analyzing Energy Project Metrics: Progress Ratio, Construction Time, and Emissions
Dive deep into energy project metrics such as Progress Ratio, Construction Time, and Lifecycle Emissions. Explore data sources and efficiency improvements for sustainable development.

Analyzing Energy Project Metrics: Progress Ratio, Construction Time, and Emissions
E N D
Presentation Transcript
En-ROADS SupportingData
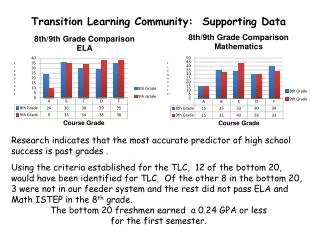
Sources include: Akiner, S. & Aldis, A. (2004), Smil,V. (2006)
Progress Ratio is the change in price with one doubling of cumulative installed capacity. A Progress Ratio above 1.0 (100%) means that a doubling of installed capacity increases the cost of the next installed capacity. Ex. - A PR of 0.9 means that, after one doubling of installed capacity, the new price is 90% of the old price. Sources include: Junginger, M., et al. (2010), McDonald, A., Schrattenholzer, L (2001)
Sources include: J. Sullivan, et al. (2010), Kris R. Voorspools, et al. (2000)
Sources include: J. Sullivan, et al. (2010), Kris R. Voorspools, et al. (2000)
Sources include: J. Sullivan, et al. (2010), Kris R. Voorspools, et al. (2000)
Development includes preconstruction activities such as performing feasibility studies, securing financing, identifying and purchasing/leasing a site, obtaining a site permit, approving and issuing a construction permit, and dealing with appeals. Sources include: Jacobson, M. Z. (2009), US Department of Energy (2008)
Construction time also includes post construction activities, such as connecting the energy source to the grid. Sources include: Jacobson, M. Z. (2009), US Department of Energy (2008)
Sources include: Jacobson, M. Z. (2009), US Department of Energy (2008)
Sources include: Jacobson, M. Z. (2009), US Department of Energy (2008)
Sources include: Hiroki, H. (2005), White, S. & Kulcinski, G. (1998)
Sources include: Hiroki, H. (2005), White, S. & Kulcinski, G. (1998)
Sources include: US Department of Energy (2011), US Bureau of Transportation Statistics (2011)
*EIA data for Germany begins in 1991; EIA world data begins in 1994 Sources: World Resources Institute (2011), US Energy Information Administration (2012)
*EIA data for Germany begins in 1991; EIA world data begins in 1994 Sources: World Resources Institute (2011), US Energy Information Administration (2012)
*Europe data range for EIA is 1994-2005 Source: US Energy Information Administration (2012)
*Europe data range for EIA is 1994-2005 Source: US Energy Information Administration (2012)
*Africa defined as Sub-Saharan Africa by WRI; Asia defined as "Asia (excluding Middle East)" by WRI and "Asia and Oceania" by EIA; Europe data range for EIA is 1994-2005 Sources: World Resources Institute (2011), US EIA (2012), International Energy Agency (2011)
2.6 w/m2 of radiative forcing indicates a CO2 equivalent concentration of 450ppm 3.7 w/m2 of radiative forcing indicates a CO2 equivalent concentration of 550ppm Sources: EMF-22, En-ROADS v56n
Sources: LBNL (1998), US Bureau of Transportation Statistics (2011), US DOE (2011)