Introduction to Body Composition
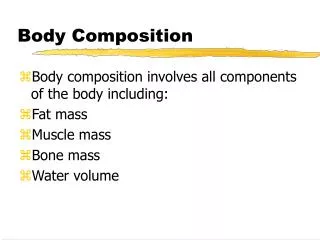
Introduction to Body Composition. Chapter 1. Exercise and Body Composition. Body composition refers to the substances that make up the body. This includes more than just fat. Exercise and Body Composition. The major components of the body for this class are: Muscle mass (protein)

Introduction to Body Composition
E N D
Presentation Transcript
Introduction to Body Composition Chapter 1
Exercise and Body Composition • Body composition refers to the substances that make up the body. • This includes more than just fat.
Exercise and Body Composition • The major components of the body for this class are: • Muscle mass (protein) • Bone mass (mineral) • Fat mass • Water volume • Known as the 4-C molecular level model
Why do we measure body composition? • Health • Performance • Insurance
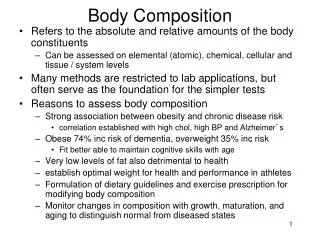
Reasons for Assessing Body Composition* • To identify a client’s health risk associated with excessively low or high levels of total body fat. • To promote a client’s understanding of health risks associated with too little or too much body fat.
Reasons for Assessing Body Composition • To monitor changes in body composition that are associated with certain diseases. • To assess the effectiveness of nutrition and exercise interventions in altering body composition.
Reasons for Assessing Body Composition • To estimate a healthy body weight for a client. • To formulatedietary recommendations and exercise programs.
Reasons for Assessing Body Composition • To monitor growth, development, maturation, and age-related changes in body composition. • (Heyward and Wagner, 2004)
Why we do not measure BC? • Grading purposes • Stereotyping • Labeling • Criticism
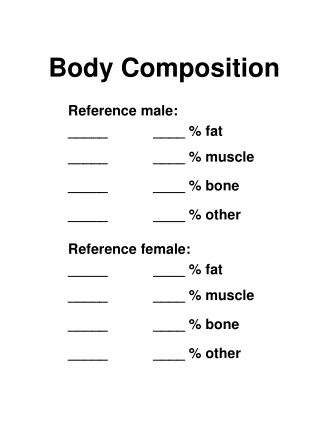
Adipose tissue Body density Body mass Body volume Densitometry Dual-energy X-ray absorptiometry Essential lipids Fat-free body density Fat-free mass Fat mass Healthy body weight Hydrometry Lean body mass Nonessential lipids Key Terms
Reference method Percent body fat Total body bone mineral Total body mineral Total body water Key Terms
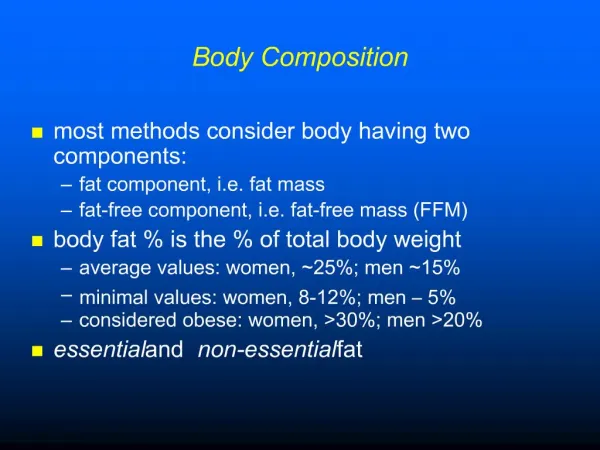
Exercise and Body Composition • Key terms related to fatness: • Overweight and underweight • Weight loss and fat loss • Overfat and underfat • Obese
Key Terms • Obesity may be defined as an excessive amount of body fat relative to body weight.
Assessment of Body Composition • Mirror • Fit of Clothes • Social Feedback • Weight
Anthropometric Techniques • Height vs Weight • Body mass index (BMI) = kg/m2 • Girth and breadth - circumferences • Skinfold measurements
Body Comp Assessment • Hydrostatic (underwater) weighing. • Bioelectrical Impedance Analysis • Air-Displacement Plythesmography (Bod Pod).
Body Comp Assessment • Computer assisted tomography
Body Composition • Most methods estimate percent body fat from body density. • Most body density estimations are drawn from a relatively small population of cadavers.
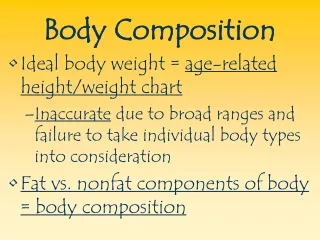
Exercise and Body Composition • Metropolitan Life Insurance Tables • Used to establish insurance premium • Based on relationship between height and weight.
Body Composition Models • See Fig 1.1
Exercise and Body Composition • The traditional two-component model of body composition defines the body in terms of its adipose tissue (AT) and lean body mass (LBM).
Exercise and Body Composition • The LBM includes essential lipids associated with the brain, nerves, membranes, etc.
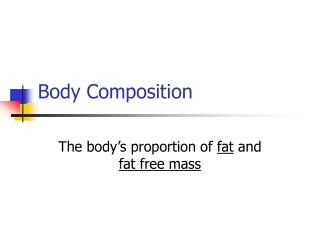
Exercise and Body Composition • This model was refined into another two-component model based on fat mass (FM) and fat free mass (FFM). • Referred to as 2-C molecular level model
Exercise and Body Composition • The fat includes all extractable lipids contained in both adipose tissue and the other tissues, and the residual is the fat free mass.
Exercise and Body Composition • A three-component model was then developed with the added component being total body water. • Referred to as the 3-C water molecular level model.
Exercise and Body Composition • A problem with all of these models was that one had to make assumptions about bone mineral and protein stores in the body.
Exercise and Body Composition • These assumptions included that bone has a density of about 3.0 gm/ml, compared with about 1.0 gm/ml for body water, about 1.34 for body protein, and about 0.9 for fat.
Exercise and Body Composition • Potential problems?
Models • This has led to the 4-C molecular level model being the desired model for research purposes • Fat • Mineral (Bone) • Protein (Muscle) • Water
Models • However, most assessment still rely on the 2-C molecular level model because it is difficult to measure the components of the 4-C model.
2-C Model • The two most common 2-C models rely on estimating percent fat from body density.
2-C Models • The 1963 Brozek model uses: %BF = (4.57/Db - 4.142) x 100
2-C Models • The 1956 Siri model uses: %BF = (4.95/Db - 4.50) x 100
2-C Models • The major difference between the models is: • In the Brozek model, any variation in measured Db from the reference body density is assumed to be due to a difference in obesity (adipose tissue).
2-C Models • In the Siri model, any variation in measured Db from the reference body is due to a difference in triglyceride content instead of adipose tissue.
2-C Models • However, they both yield nearly identical %BF estimates (varying by only 0.5-1.0% BF) for densities ranging from 1.0300 to 1.0900 g/cc.
2-C Models • For individuals with more than 30% BF, the Siri equation gives relatively higher body fat estimates than the Brozek equation.
2-C Models • Both rely on the following assumptions: • The densities of the fat and the fat-free body components (water, mineral, and protein) are additive and are the same for all individuals • The proportions of water, mineral, and protein in the LBM or reference body are constant within and between individuals
Assumptions • The individual being measured differs from the reference body only in the amount of body fat (triglyceride) or obesity (adipose) tissue.
Fat-Free Body Composition Component Density Fat-free body Reference body (g/cc) (%) (%) Water 0.9937 73.8 Mineral 3.038 6.8 Protein 1.34 19.4 Fat-free body 1.1 100 84.7 Fat 0.9007 15.3 Reference 1.064 100 body From Table 1.3
Body Density • Density has traditionally been defined as 1.10 gm/ml. • In young African American males, some studies have shown it to be 1.113 gm/ml. • 8-10 yr old ~ 1.085 gm/ml.
2-C Model Problems • If you deviated from the reference cadaver, the ability to predict your percent body fat diminished. See Table 1.4 (p. 9) for specific equations
Which technique should be used? • Purpose of assessment. • Accuracy required. • Time required. • Availability of equipment. • Training of personnel. • Expense.
Which technique should be used? • At present, experts agree that a multi-component approach should be used whenever possible, especially for development and validation of body composition methods and prediction equations.
Standards for Comparison • Vary greatly depending on the source • See Table 1.2 for percent body fat standards for adults, children, and physically active adults.
BMI (kg/m2) Obesity Class Underweight <18.5 Normal Weight 18.5-24.9 Overweight 25-29.9 Obesity 30-34.9 I 35-39.9 II > 40 III Overweight and Obesity (BMI) WHO 1998
Standards of Fatness Men Women Underfatness<3<12 Essential Fat 3 12 Optimal Health 3-20 12-30 Overfatness 20-25 30-35 Obesity >25 >35
1 minus Computing Target Wt assuming all wt. Loss is fat Fill in boxes with double lines and compute others Goal % Fat* Current % Fat* Goal % LBM* by X Current Body Wt Current Fat Wt Current LBM Target Body Wt minus * % is expressed as a decimal. Divide by 100 before entering the data.