Download
1 / 15
160 likes | 310 Views
Body composition refers to the ratio of fat to lean mass in the body, which is crucial for assessing health. Ideal body weight can be evaluated through age-related height/weight charts but may not reflect individual body types. It's important to maintain a certain fat percentage—female (20-25%), male (12-15%)—to preserve essential fat for organ protection. Weight management requires a combined approach of exercise and dietary modifications. Effective strategies involve lifestyle changes, understanding caloric needs, and methods for both weight loss and gain, emphasizing moderation.

E N D
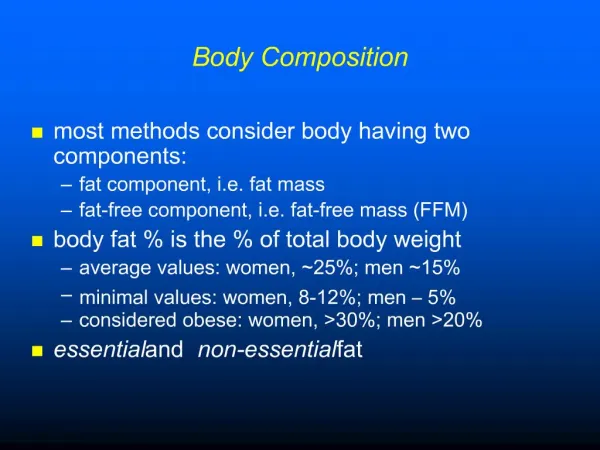
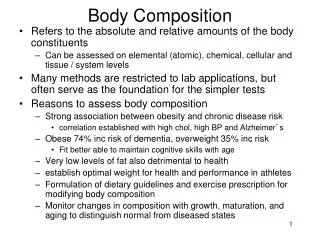
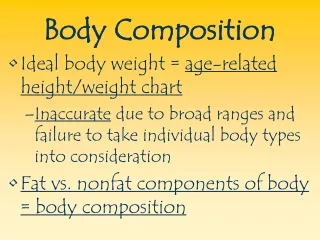
Body Composition • Ideal body weight = age-related height/weight chart • Inaccurate due to broad ranges and failure to take individual body types into consideration • Fat vs. nonfat components of body = body composition
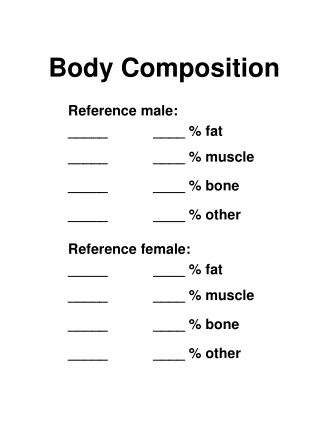
Non-fat or lean tissue (lean body weight) • bone, muscle, tendon, connective tissue • Averages • Female 20-25% body weight = fat • Male 12-15% body weight = fat • Should not fall below 3% (males) and 12 % (females) • Results in loss of essential fat padding for organs • Obesity = extreme amount of excessive fat • Female >30% and male >20% percent body fat
Adipose cell stores triglycerides (liquid fat) • Moves in and out of cells according to energy demands • Moderate, long term activity uses greatest amount of fat • One pound of fat = 3500 calories, stored as triglycerides
Assessing Body Composition • Several methods • Hydrostatic, bioelectrical impedance, skinfold thickness measures • Skinfolds based on the fact that 50% of body fat is subcutaneous • Utilize skin fold calipers • Relatively low accuracy but is easy to learn and utilize • Error is + 3-5%
Determining Body Mass Index • BMI (body mass index) is a ratio of height and weight • Utilized to measure health risks associated with obesity • BMI >25 indicate excess body fat • BMI 25-30 indicates overweight • BMI >30 indicates state of obesity
To calculate your exact BMI value, multiply your weight in pounds by 703, divide by your height in inches, then divide again by your height in inches.
Methods of Weight Loss • Exercise or dieting alone is ineffective over the long run • Dieting alone results in lean body tissue loss • Should not drop below 1000-1200 calories for women and 1200-1400 for men • Exercising, while resulting in loss of fat mass, will also enhance strength, cardiorespiratory endurance and flexibility • The key is moderation
Science of Weight loss • Energy is measured in calories • Only a calorie deficit will result in weight loss • Safest practice is to change lifestyle • 1 to 2 lbs per week • Light to moderate exercise • -500 calories per day = 3500 calories/wk = 1lb of fat.
Low Carbohydrate Diets and Weight Loss • New recommendations = limit CHO • Typically involves replacement of CHO with fat and protein • Consuming high CHO diet results in: • Increased blood glucose • Stimulates hunger signals from brain • Creates a cycle
Reducing CHO • Increases glucagon (increases fat burning) • Also causes cholesterol removal from arteries • Severe CHO restriction results in ketosis • Blood glucose levels stabilize • Insulin levels drop • Body is already burning fat – rapid weight loss occurs
Methods of Weight Gain • Aim should be to increase lean body mass • Increased physical activity (muscle work) and dietary modifications • Approximately 2500 calories is required per pound of lean body mass, an increase 500-1000 calories per day • A 1-2 pound per week gain is adequate