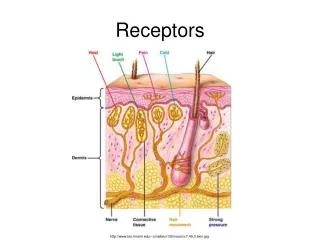
3. Receptors
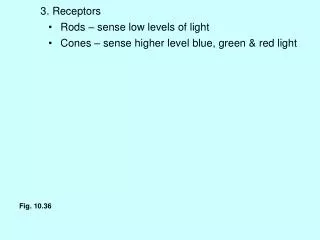
3. Receptors. Rods – sense low levels of light. Cones – sense higher level blue, green & red light. Fig. 10.36. 3. Receptors. Rods – sense low levels of light. Cones – sense higher level blue, green & red light. Fig. 10.40. 3. Receptors. Rods – sense low levels of light.

3. Receptors
E N D
Presentation Transcript
3. Receptors • Rods – sense low levels of light • Cones – sense higher level blue, green & red light Fig. 10.36
3. Receptors • Rods – sense low levels of light • Cones – sense higher level blue, green & red light Fig. 10.40
3. Receptors • Rods – sense low levels of light • Cones – sense higher level blue, green & red light C. Receptor transduction 1. Rhodopsin Fig. 10.36
3. Receptors • Rods – sense low levels of light • Cones – sense higher level blue, green & red light C. Receptor transduction 1. Rhodopsin • Retinene (photopigment) + opsin (protein) 2. Light • Retinene – cis trans configuration Fig. 10.37
C. Receptor transduction 1. Rhodopsin • Retinene (photopigment) + opsin (protein) 2. Light • Retinene – cis trans configuration Fig. 10.37
C. Receptor transduction 1. Rhodopsin • Retinene (photopigment) + opsin (protein) 2. Light • Retinene – cis trans configuration 3. trans Retinene • Activates g-protein (transducin) cascade • Closes Na+ channels • Hyperpolarizes cell Fig. 10.37
3. trans Retinene • Activates g-protein (transducin) cascade • Closes Na+ channels • Hyperpolarizes cell Fig. 10.37
3. trans Retinene • Activates g-protein (transducin) cascade • Closes Na+ channels • Hyperpolarizes cell D. Dark vs. light 1. Dark • Photoreceptors depolarized and inhibitory • Inhibit adjacent cells in retina
D. Dark vs. light 1. Dark • Photoreceptors depolarized and inhibitory • Inhibit adjacent cells in retina 2. Light Fig. 10.39
1. Dark • Photoreceptors inhibitory and depolarized • Inhibit adjacent cells in retina 2. Light • Receptors hyperpolarized (inhibited) Fig. 10.39
1. Dark • Photoreceptors inhibitory and depolarized • Inhibit adjacent cells in retina 2. Light • Receptors hyperpolarized (inhibited) • Light is sensed E. Dark adaptation 1. Light • Receptors “bleached” • rhodopsin in receptors 2. Dark • 1st 5 minutes – rhodopsin in cones • ~ 20 minutes – max sensitivity
E. Dark adaptation 1. Light • Receptors “bleached” • rhodopsin in receptors 2. Dark • 1st 5 minutes – rhodopsin in cones • ~ 20 minutes – max. sensitivity • Due to rhodopsin in rods • Light sensitivity by 100,000x Chapter 11 – Endocrine Endocrine glands – secrete into blood
Chapter 11 – Endocrine Endocrine glands – secrete into blood I. General info. A. Classifications Fig. 11.1
Chapter 11 – Endocrine Endocrine glands – secrete into blood I. General info. A. Classifications 1. Amines – derived from single amino acids • Thyroid hormone Fig. 11.3 • Epinephrine Fig. 9.9
I. General info. A. Classifications 1. Amines – derived from single amino acids • Thyroid hormone • Epinephrine 2. Polypeptides – chains of amino acids • Antidiuretic hormone • Insulin disulfide bridges
I. General info. A. Classifications 1. Amines – derived from single amino acids • Thyroid hormone • Epinephrine 2. Polypeptides – chains of amino acids • Antidiuretic hormone • Insulin 3. Glycoproteins – carbohydrate + amino acids chains • Follicle stimulating hormone (FSH) • Luteinizing hormone (LH) 4. Steroids – based on cholesterol (lipid)
3. Glycoproteins – carbohydrate + amino acids chains • Follicle stimulating hormone (FSH) • Luteinizing hormone (LH) 4. Steroids – based on cholesterol (lipid) • Progesterone • Testosterone Fig. 11.2 • Cortisol
3. Glycoproteins – carbohydrate + amino acids chains • Follicle stimulating hormone (FSH) • Luteinizing hormone (LH) 4. Steroids – based on cholesterol (lipid) • Progesterone • Testosterone • Cortisol B. Pre- vs. Prohormones 1. Prohormones • Peptide contained in longer peptide (e.g. opioids)
B. Pre- vs. Prohormones 1. Prohormones • Peptide contained in longer peptide (e.g. opioids) • Unessential peptide portions cleaved • True of all peptide hormones
B. Pre- vs. Prohormones 1. Prohormones • Peptide contained in longer peptide (e.g. opioids) • Unessential peptide portions cleaved • True of all peptide hormones 2. Prehormones • Single molecule (e.g. thyroid hormone) • Inactive until changed by target cell Fig. 11.3
B. Pre- vs. Prohormones 1. Prohormones • Peptide contained in longer peptide (e.g. opioids) • Unessential peptide portions cleaved • True of all peptide hormones 2. Prehormones • Single molecule (e.g. thyroid hormone) • Inactive until changed by target cell C. Hormone common aspects • Blood born • Receptors on/in target cells • Specific effect on target cell
C. Hormone common aspects • Blood born • Receptors on/in target cells • Specific effect on target cell • Can be turned off D. Interactions 1. Synergistic • Additive or complementary • e.g. – epinephrine & norepi. on heart 2. Permissive
D. Interactions 1. Synergistic • Additive or complementary • e.g. – epinephrine & norepi. on heart 2. Permissive • Hormone increases responsiveness of different hormone • e.g. – cortisol allows epi. & norepi. to have catabolic effects 3. Priming effect • Hormone presence increases sensitivity/effect of same hormone
2. Permissive • Hormone increases responsiveness of different hormone • e.g. – cortisol allows epi. & norepi. to have catabolic effects 3. Priming effect • Hormone presence increases sensitivity/effect of same hormone • e.g. – GnRH causes AP to be more sensitive to GnRH 4. Antagonistic • Opposite effects
3. Priming effect • Hormone presence increases sensitivity/effect of same hormone • e.g. – GnRH causes AP to be more sensitive to GnRH 4. Antagonistic • Opposite effects • e.g. – Insulin ( glucose stores) & glucagon ( glucose stores) E. Hormone levels 1. Half-life • Time for metabolic clearance of half of hormone
E. Hormone levels 1. Half-life • Time for metabolic clearance of half of hormone 2. Physiological levels • Normal levels 3. Pharmacological levels • Abnormally high levels • Different physiological effects 4. Downregulation/desensitization • Prolonged exposure • sensitivity of target tissue
4. Downregulation/desensitization • Prolonged exposure • sensitivity of target tissue II. Hormone mechanisms A. Steroid hormones 1. Transport • On carrier protein in blood
II. Hormone mechanisms A. Steroid hormones 1. Transport • On carrier protein in blood • Passive diffusion through membrane Fig. 11.4
A. Steroid hormones 1. Transport • On carrier protein in blood • Passive diffusion through membrane • Binds receptor in cytoplasm 2. Receptor • Ligand binding domain – binds steroid • DNA binding domain – binds DNA 3. Receptor-ligand complex Fig. 11.5
2. Receptor • Ligand binding domain – binds steroid • DNA binding domain – binds DNA 3. Receptor-ligand complex • Translocates to nucleus • Two complexes bind two receptor half sites on DNA (dimerization) Fig. 11.5 Fig. 11.4
3. Receptor-ligand complex • Translocates to nucleus • Two complexes bind two receptor half sites on DNA (dimerization) • Form homodimer • Activate transcription Fig. 11.5 Fig. 11.4
3. Receptor-ligand complex • Translocates to nucleus • Two complexes bind two receptor half sites on DNA (dimerization) • Form homodimer • Activate transcription 4. On DNA • Hormone response element recognized by complex Fig. 11.5
Form homodimer • Activate transcription 4. On DNA • Hormone response element recognized by complex • 2 must bind (dimerization) for activity B. Thyroid hormone • T3 and T4 • Based on # of iodines Fig. 11.5
B. Thyroid hormone • T3 and T4 • Based on # of iodines • T4 converted to T3 (active form) in cell 1. Transport • Most carried on proteins in blood Fig. 11.3
B. Thyroid hormone • T3 and T4 • Based on # of iodines • T4 converted to T3 (active form) in cell 1. Transport • Most carried on proteins in blood • Passive diffusion into cell
T4 converted to T3 (active form) in cell 1. Transport • Most carried on proteins in blood • Passive diffusion into cell Fig. 11.6 2. Receptor-ligand complex • Formed in nucleus • Complex forms heterodimer
2. Receptor-ligand complex • Formed in nucleus • Complex forms heterodimer • Other site bound by receptor-RXR (vit. A) complex Fig. 11.6 • Transcription produces specific enzymes Fig. 11.7
2. Receptor-ligand complex • Formed in nucleus • Complex forms heterodimer • Other site bound by receptor-RXR (vit. A) complex • Transcription produces specific enzymes C. 2nd messenger – adenylate cyclase
Other site bound by receptor-RXR (vit. A) complex • Transcription produces specific enzymes C. 2nd messenger – adenylate cyclase • Membrane receptor binding • Intracellular g-protein subunit dissociation Fig. 11.8
C. 2nd messenger – adenylate cyclase • Membrane receptor binding • Intracellular g-protein subunit dissociation • Subunit activates adenylate cyclase • Forms cAMP from ATP Fig. 11.8
Intracellular g-protein subunit dissociation • Subunit activates adenylate cyclase • Forms cAMP from ATP • cAMP activates protein kinase Fig. 11.8
Subunit activates adenylate cyclase • Forms cAMP from ATP • cAMP activates protein kinase • Protein kinase phosphorylates (adds a phosphate) specific enzymes Fig. 11.8
Forms cAMP from ATP • cAMP activates protein kinase • Protein kinase phosphorylates (adds a phosphate) specific enzymes • Enzymes activated or inhibited Fig. 11.8
Forms cAMP from ATP • cAMP activates protein kinase • Protein kinase phosphorylates (adds a phosphate) specific enzymes • Enzymes activated or inhibited D. Phospholipase C-Ca++ second messenger • Membrane receptor binding • G-protein dissociates intracellularly
D. Phospholipase C-Ca++ second messenger • Membrane receptor binding • G-protein dissociates intracellularly • Activates phospholipase C (PLC) • Releases inositol trisphosphate (IP3) from lipid • IP3 releases Ca++ from endoplasmic reticulum Fig. 11.9
Membrane receptor binding • G-protein dissociates intracellularly • Activates phospholipase C (PLC) • Releases inositol trisphosphate (IP3) from lipid • IP3 releases Ca++ from endoplasmic reticulum • Ca++ activates calmodulin • Calmodulin has a variety of effects Fig. 11.9