Download
1 / 40
410 likes | 720 Views
Chapter 19: Conventional Energy. 19.1 Energy Resources And Uses. How do we measure energy? Fossil fuels supply most of the world’s energy What are the current sources of U.S. energy? . Measuring Energy. Joule = Energy to raise 1 kg 10 cm Energy to Move 500 g (a Pound) 1 m/sec

E N D
19.1 Energy Resources And Uses • How do we measure energy? • Fossil fuels supply most of the world’s energy • What are the current sources of U.S. energy?
Measuring Energy • Joule = Energy to raise 1 kg 10 cm • Energy to Move 500 g (a Pound) 1 m/sec • calorie = Energy to heat 1 gm Water 1 C • Calorie = Energy to heat 1 kg Water 1 C • 1000 calories • Food Calorie • Equals 4200 joules • Watt = 1 joule/second • Human body outputs about 100 watts
Quads • Btu = British Thermal Unit = Energy to heat a pound of Water 1 Degree F • 1 Btu = 1055 J • Many Energy Reports use Quads = 1 Quadrillion (1015) Btu • 1 Quad = 1.055 x 10¹⁸ J
World Energy Use • Total about 150,000 TWh = 540 x 1018 J = 128,000 Megatons
U.S. Energy Use • Total about 27,000 TWh = 97 x 1018 J = 23,000 Megatons
Economics • 2000 WINNEBAGO CHIEFTAIN SERIES M-36LP-DSL • Average Retail Price: $51,600 • Suggested List: $140,851 • Source: NADAGuides.com (23 April 2010) • Ten-Year Cost: $89,251 • @$300/day = 297 days = 30 days/year
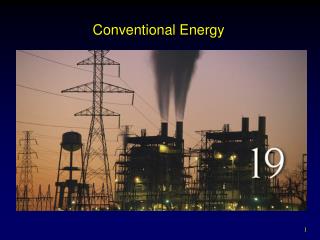
19.2 Coal • Coal resources are vast • Coal mining is a dirty, dangerous business • Burning coal releases many pollutants • Clean coal technology could be helpful
19.3 Oil • Oil resources aren’t evenly distributed • Like other fossil fuels, oil has negative impacts • What Do You Think? Oil Drilling in ANWR • Oil shales and tar sands contain huge amounts of petroleum
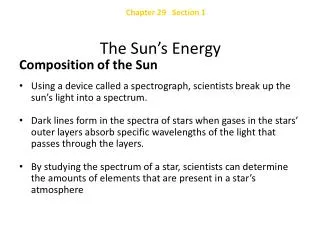
Petroleum A hydrocarbon molecule What organisms make these? Answer: None
Petroleum • Lots of organisms make these, however • Fatty Acids • Probable source: Marine plankton
Hubbert Curves • In 1956, Oil geologist M. King Hubbert noted that rates of oil production follow a bell-shaped curve. • Cumulative production follows a slanting S- curve • Production lags discovery by about ten years.
What if We Find More Oil? • Even a huge increase in total oil has very little effect on the peak and decline of production. • Why? We waste most of it on inefficient uses.
Is There a Lot More Undiscovered Oil? • 80 per cent of oil being produced today is from fields discovered before 1973. • In the 1990's oil discoveries averaged about seven billion barrels of oil a year, only one third of usage. • The discovery rate of multi-billion barrel fields has been declining since the 1940's, that of giant (500-million barrel) fields since the 1960's. • In 1938, fields with more than 10 million barrels made up 19% of all new discoveries, but by 1948 the proportion had dropped to only 3%.
U.S. Petroleum Use • 2009 - 7,121,644,500 barrels • 2007 - 6,257,125,000 barrels • 2006 - 6,384,780,000 barrels • 2005 - 6,470,457,000 barrels • 2004 - 6,410,770,000 barrels • 2003 - 6,175,244,000 barrels • 2002 - 5,945,585,000 barrels • = 19,498,000 barrels a day • = 1 billion barrels in < two months
Global Petroleum Usage • 2008 projection: 87 million barrels/day • = 31.8 billion barrels per year • = 1 billion barrels in 11.5 days • = 1000 barrels/second • U.S. = 25% of total
Oil Fantasies “America is sitting on top of a super massive 200 billion barrel Oil Field that could potentially make America Energy Independent and until now has largely gone unnoticed. Thanks to new technology the Bakken Formation in North Dakota could boost America’s Oil reserves by an incredible 10 times, giving western economies the trump card against OPEC’s short squeeze on oil supply and making Iranian and Venezuelan threats of disrupted supply irrelevant” (Next Energy News, 13 February 2008)
Realty Check • 200 billion barrels @ 20 million barrels a day = 10,000 days = 27 years • Then what? • Reality: maybe 10% of the oil is recoverable with known technology • The Bakken is a “tight” formation • Horizontal drilling can increase yields
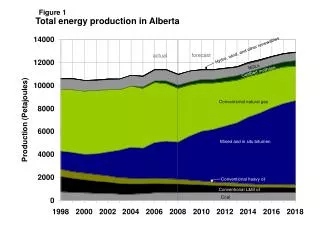
Canadian Oil Sands • 170 billion recoverable barrels • 10 x larger total amount • Current production: 1.2 million barrels/day • Projected production in 2015 = 3 million barrels per day • 3 million barrels = 4 hours of U.S. petroleum consumption
19.4 Natural Gas • Most of the world’s known natural gas is in a few countries • There may be vast unconventional gas sources • Coal-Bed Methane • Fracking • Methane Hydrates
Gas Hydrates • Hydrocarbons trapped in cage of water molecules • Freeze above 0 C under moderate pressure • Solid gas hydrates occur in marine sediments (“yellow ice”) • Potentially huge energy resource • Possible role in climate change?
19.5 Nuclear Power • How do nuclear reactors work? • There are many different reactor designs • Some alternative reactor designs may be safer • Breeder reactors could extend the life of our nuclear fuel
19.6 Radioactive Waste Management • We lack safe storage for radioactive wastes • Decommissioning old nuclear plants is expensive
19.7 Changing Fortunes Of Nuclear Power • Nuclear Explosives Once Envisioned For: • Mining • Deepening Harbors • Large Excavations • Anything that Required Large Amounts of Explosives • We Were Going to Have Nuclear • Cars • Airplanes • Trains
We Had a Long Range Energy Plan • Before Fossil Fuels Ran Short, Nuclear Power Would Take Over • By About 2000, We’d Have Fusion Power