Nonrenewable Energy
1.01k likes | 1.29k Views
Nonrenewable Energy. Chapter 15. Core Case Study: How Long Will Supplies of Conventional Oil Last?. Oil: energy supplier How much is left? When will we run out? Three options Look for more Reduce oil use and waste Use other energy sources No easy solutions.

Nonrenewable Energy
E N D
Presentation Transcript
Nonrenewable Energy Chapter 15
Core Case Study: How Long Will Supplies of Conventional Oil Last? • Oil: energy supplier • How much is left? When will we run out? • Three options • Look for more • Reduce oil use and waste • Use other energy sources • No easy solutions
Thunder Horse Offshore Floating Oil Production Platform in the Gulf of Mexico
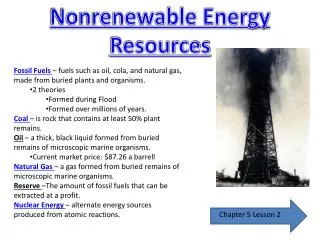
15-1 What Major Sources of Energy Do We Use? • Concept 15-1A About three-quarters of the world’s commercial energy comes from nonrenewable fossil fuels and the rest comes from nonrenewable nuclear fuel and renewable sources. • Concept 15-1B Net energy is the amount of high-quality usable energy available from a resource after the amount of energy needed to make it available is subtracted.
Fossil Fuels Supply Most of Our Commercial Energy • Solar energy • Indirect solar energy • Wind • Hydropower • Biomass • Commercial energy • Nonrenewable energy resources, e.g. fossil fuels • Renewable energy resources
Oil and natural gas Oil storage Coal Geothermal energy Contour strip mining Oil drilling platform Hot water storage Geothermal power plant Oil well Pipeline Gas well Mined coal Pipeline Area strip mining Pump Drilling tower Underground coal mine Impervious rock Natural gas Oil Water Water is heated and brought up as dry steam or wet steam Water Coal seam Hot rock Water penetrates down through the rock Magma Fig. 15-2, p. 372
Commercial Energy Use by Source for the World and the United States
Nuclear power 6% Geothermal, solar, wind 2.5% Nuclear power 8% Geothermal, solar, wind 1% Hydropower 4.5% Hydropower, 3% Natural gas 23% Natural gas 21% RENEWABLE 18% Biomass 11% Coal 23% Biomass 3% RENEWABLE 7% Coal 22% Oil 39% Oil 33% NONRENEWABLE 82% NONRENEWABLE 93% World United States Fig. 15-3, p. 373
Case Study: A Brief History of Human Energy Use • Muscle power: early humans • Discovery of fire • Agriculture • Use of wind and flowing water • Machines powered by wood, then coal • Internal combustion engine • Nuclear energy • Energy crisis
How Should We Evaluate Energy Resources? • Supplies • Environmental impact • How much useful energy is provided?
Science Focus: Net Energy Is the Only Energy That Really Counts • It takes energy to get energy • Second Law of Thermodynamics • Net energy expressed as net energy ratio • Conventional oil: high net energy ratio • Electricity produced by the nuclear power fuel cycle: low net energy ratio
Net Energy Ratios for Various Energy Systems over Their Estimated Lifetimes
Space Heating Passive solar 5.8 Natural gas 4.9 Oil 4.5 Active solar 1.9 Coal gasification 1.5 Electric heating (coal-fired plant) 0.4 Electric heating (natural-gas-fired plant) 0.4 Electric heating (nuclear plant) 0.3 Fig. 15-A (1), p. 374
High-Temperature Industrial Heat 28.2 Surface-mined coal 25.8 Underground-mined coal Natural gas 4.9 Oil 4.7 Coal gasification 1.5 0.9 Direct solar (concentrated) Fig. 15-A (2), p. 374
Transportation Ethanol from sugarcane residue 8.0 Ethanol from switchgrass 5.4 Natural gas 4.9 Gasoline (refined crude oil) 4.1 Coal liquefaction 1.4 Oil shale 1.2 Ethanol from corn 1.1 (but can reach 1.5) Fig. 15-A (3), p. 374
Space Heating Passive solar 5.8 Natural gas 4.9 Oil 4.5 1.9 Active solar 1.5 Coal gasification 0.4 Electric heating (coal-fired plant) 0.4 Electric heating (natural-gas-fired plant) 0.3 Electric heating (nuclear plant) High-Temperature Industrial Heat 28.2 Surface-mined coal Underground-mined coal 25.8 Natural gas 4.9 4.7 Oil Coal gasification 1.5 Direct solar (concentrated) 0.9 Transportation Ethanol from sugarcane residue 8.0 Ethanol from switchgrass 5.4 Natural gas 4.9 Gasoline (refined crude oil) 4.1 Coal liquefaction 1.4 Oil shale 1.2 Ethanol from corn 1.1 (but can reach 1.5) Stepped Art Fig. 15-A, p. 374
15-2 What Are the Advantages and Disadvantages of Oil? • Concept 15-2A Conventional oil is currently abundant, has a high net energy yield, and is relatively inexpensive, but using it causes air and water pollution and releases greenhouse gases to the atmosphere. • Concept 15-2B Heavy oils from oil sand and oil shale exist in potentially large supplies but have low net energy yields and higher environmental impacts than conventional oil has.
We Depend Heavily on Oil • Petroleum, or crude oil = conventional, or light oil • Fossil fuels: crude oil and natural gas • Oil extraction and refining • Petrochemicals: products of oil distillation • World oil consumption
Lowest Boiling Point Gases Gasoline Aviation fuel Heating oil Diesel oil Naphtha Grease and wax Heated crude oil Asphalt Furnace Highest Boiling Point Fig. 15-4a, p. 375
OPEC Controls Most of the World’s Oil Supplies (1) • 13 countries have at least 60% of the world’s crude oil reserves • Saudi Arabia: 25% • Canada: 15% • Oil production peaks and flow rates to consumers
OPEC Controls Most of the World’s Oil Supplies (2) • Possible effects of steeply rising oil prices • Reduce energy waste • Shift to non-carbon energy sources • Higher prices for products made with petrochemicals • Higher food prices; buy locally-produced food • Airfares higher • Smaller more fuel-efficient vehicles • Upgrade of public transportation
The United States Uses Much More Oil Than It Produces (1) • Produces 9% of the world’s oil • Imports 60% of its oil • About One-fourth of the world’s conventional oil is controlled by countries that sponsor or condone terrorism
The United States Uses Much More Oil Than It Produces (2) Should we look for more oil reserves? Extremely difficult Expensive and financially risky A new role for bacteria in the oil industry
Case Study: Oil and the U.S. Arctic National Wildlife Refuge • The Arctic National Wildlife Refuge (ANWR) • Not open to oil and gas development • Fragile tundra biome • Oil companies lobbying since 1980 to begin exploratory drilling • Pros • Cons
14 13 12 11 Projected U.S. oil consumption 10 9 Barrels of oil per year (billions) 8 7 6 5 4 3 Arctic refuge oil output over 50 years 2 1 0 2000 2010 2020 2030 2040 2050 Year Fig. 15-5, p. 378
Conventional Oil Has Advantages and Disadvantages • Extraction, processing, and burning of nonrenewable oil and other fossil fuels • Advantages • Disadvantages
TRADE-OFFS Conventional Oil Advantages Disadvantages Ample supply for 42–93 years Need to find substitutes within 50 years Low cost Large government subsidies High net energy yield Environmental costs not included in market price Easily transported within and between countries Artificially low price encourages waste and discourages search for alternatives Low land use Pollutes air when produced and burned Technology is well developed Releases CO2 when burned Efficient distribution system Can cause water pollution Fig. 15-6, p. 379
Will Heavy Oil Spills from Oil Sand Be a Viable Option? • Oil sand, tar sand contains bitumen • Canada and Venezuela: oil sand have more oil than in Saudi Arabia • Extraction • Serious environmental impact before strip-mining • Low net energy yield: Is it cost effective?
Will Oil Shales Be a Useable Resource? • Oil shales contain kerogen • After distillation: shale oil • 72% of the world’s reserve is in arid areas of western United States; there is a catch! • Locked up in rock • Lack of water needed for extraction and processing • Low net energy yield
TRADE-OFFS Heavy Oils from Oil Shale and Oil Sand Advantages Disadvantages Moderate cost (oil sand) High cost (oil shale) Low net energy yield Large potential supplies, especially oil sands in Canada Environmental costs not included in market price Easily transported within and between countries Large amounts of water needed for processing Severe land disruption Efficient distribution system in place Severe water pollution Air pollution and CO2 emissions when produced and burned Technology well-developed (oil sand) Fig. 15-9, p. 380
15-3 What Are the Advantages and Disadvantages of Natural Gas? • Concept 15-3 Conventional natural gas is more plentiful than oil, has a high net energy yield and a fairly low cost, and has the lowest environmental impact of all fossil fuels.
Natural Gas Is a Useful and Clean-Burning Fossil Fuel (1) • Natural gas: mixture of gases • More than half is CH4 • Conventional natural gas • Pipelines • Liquefied petroleum gas (LPG) • Liquefied natural gas (LNG) – low net energy yield
Natural Gas Is a Useful and Clean-Burning Fossil Fuel (2) • Unconventional natural gas • Coal bed methane gas • Methane hydrate
Natural Gas Has More Advantages Than Disadvantages • Will natural gas be the bridge fuel helping us make the transition to a more sustainable energy future?
TRADE-OFFS Conventional Natural Gas Advantages Disadvantages Ample supplies Nonrenewable resource High net energy yield Releases CO2 when burned Low cost Government subsidies Gas turbine Less air pollution than other fossil fuels Environmental costs not included in market price Lower CO2 emissions than other fossil fuels Methane (a greenhouse gas) can leak from pipelines Easily transported by pipeline Difficult to transfer from one country to another Low land use Good fuel for fuel cells, gas turbines, and motor vehicles Can be shipped across ocean only as highly explosive LNG Fig. 15-10, p. 382
15-4 What Are the Advantages and Disadvantages of Coal? • Concept 15-4A Conventional coal is very plentiful and has a high net energy yield and low cost, but it has a very high environmental impact. • Concept 15-4B Gaseous and liquid fuels produced from coal could be plentiful, but they have lower net energy yields and higher environmental impacts than conventional coal has.